A severe heatwave in South Australia yesterday culminated in increased usage that pushed demand beyond the capabilities of the generators. This led to outages in the network as the market operator commenced load shedding.
Demand was the highest it had been for three years with the maximum five-minute demand set at 3077.47MW at 6:15 p.m. market time. This is despite a continued uptake of residential solar photovoltaic (PV) systems.
There were some interesting announcements leading into the period. The Australian Energy Market Operator (AEMO) was aware this was an unusual event and published a market notice at 3:15 p.m. (market time) to be aware that temperatures would be high across SA, NSW and QLD.
There were concerns surrounding reserves for SA most of the day. AEMO operates with three Lack-of-Reserve (LOR) levels.
LOR1: If the largest unit fails there will be a LOR2 condition
LOR2: If the largest unit fails, there will be a loss of power
LOR3: There is an actual loss of power. There is no solution in which all demand can be met
There were several LOR1 conditions during the day but AEMO didn’t respond. More interestingly was a LOR2 warning at 5:13 p.m. (market time) stating that AEMO was aware of an actual LOR2 condition forecast until 7:00 p.m. (market time). Required contingency was 200 MW but there was only 114 MW available. AEMO decided not to intervene but wanted to seek a market response. As we now know, the LOR2 turned into an LOR3 as wind generation reduced.
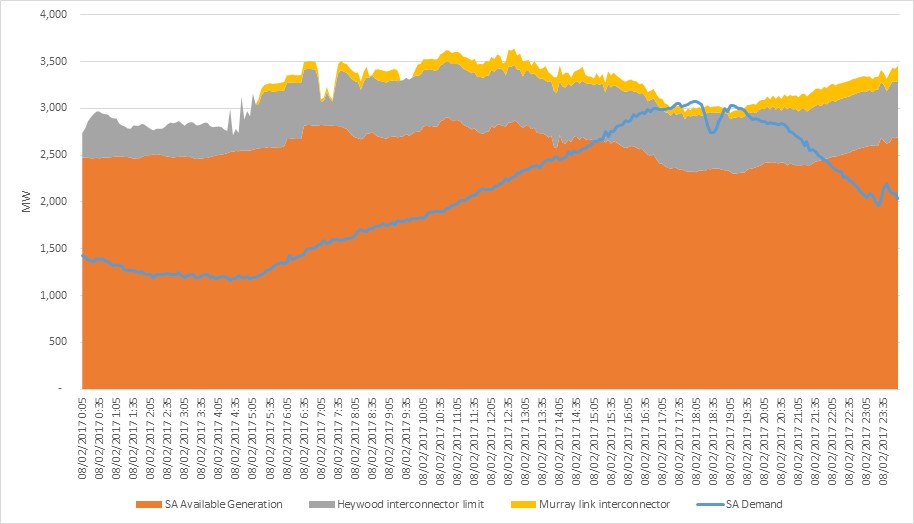
The orange area represents the available generation for the state with the grey and yellow being the maximum support from the interconnector. The blue line is SA (five-minute) demand. The heat didn’t dissipate as the day wore on. Electricity demand continued to rise with the addition of domestic air conditioners as residents were returning home. The drop in the orange availability represents the reduction in wind. As wind kept reducing in capacity, there was insufficient power in the state to meet demand and there were rolling brown-outs.
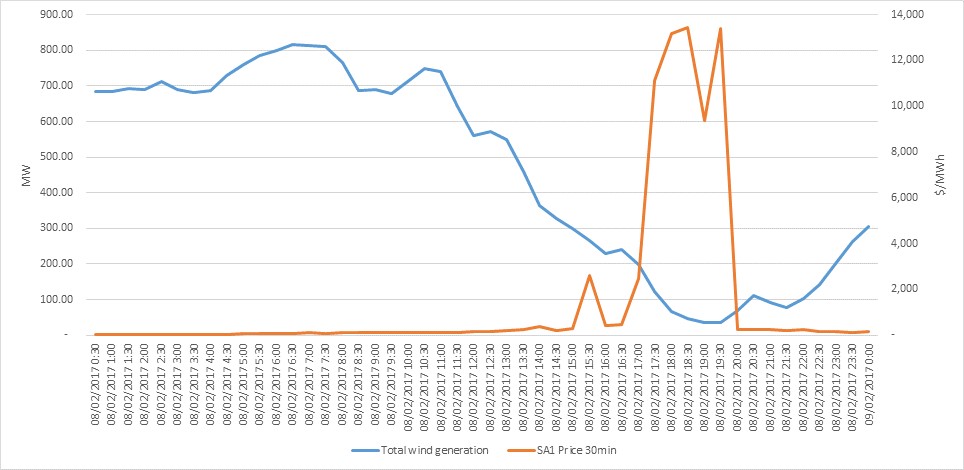
The 30-minute wind generation data shows the drop in availability. Wind generation is affected during hot weather as there isn’t enough energy in warm wind.
There are wide reports that additional power stations were available but didn’t run. Torrens Island A and Pelican Point each had a unit which was not available. It is unlikely there was enough gas going to the power stations to start another unit.
It is very questionable what market response AEMO was expecting at 5:13 p.m. since all available generators were on (except one unit at Pelican Point and one at Torrens Island A). From the outside, it looks like they were hoping LOR2 would not become LOR3.
With temperatures forecast at similar levels today, more outages can be expected. With the political backlash, it is unlikely there would be an appetite to curtail residential customers again. This could mean that AEMO and the Government may prefer to take the risk with business and commercial customers instead.
If you’re looking for stability in your energy pricing, please contact our energy procurement experts here or on 07 3232 1115.