Renewable energy storage road map released

Edge 2020 Brisbane City

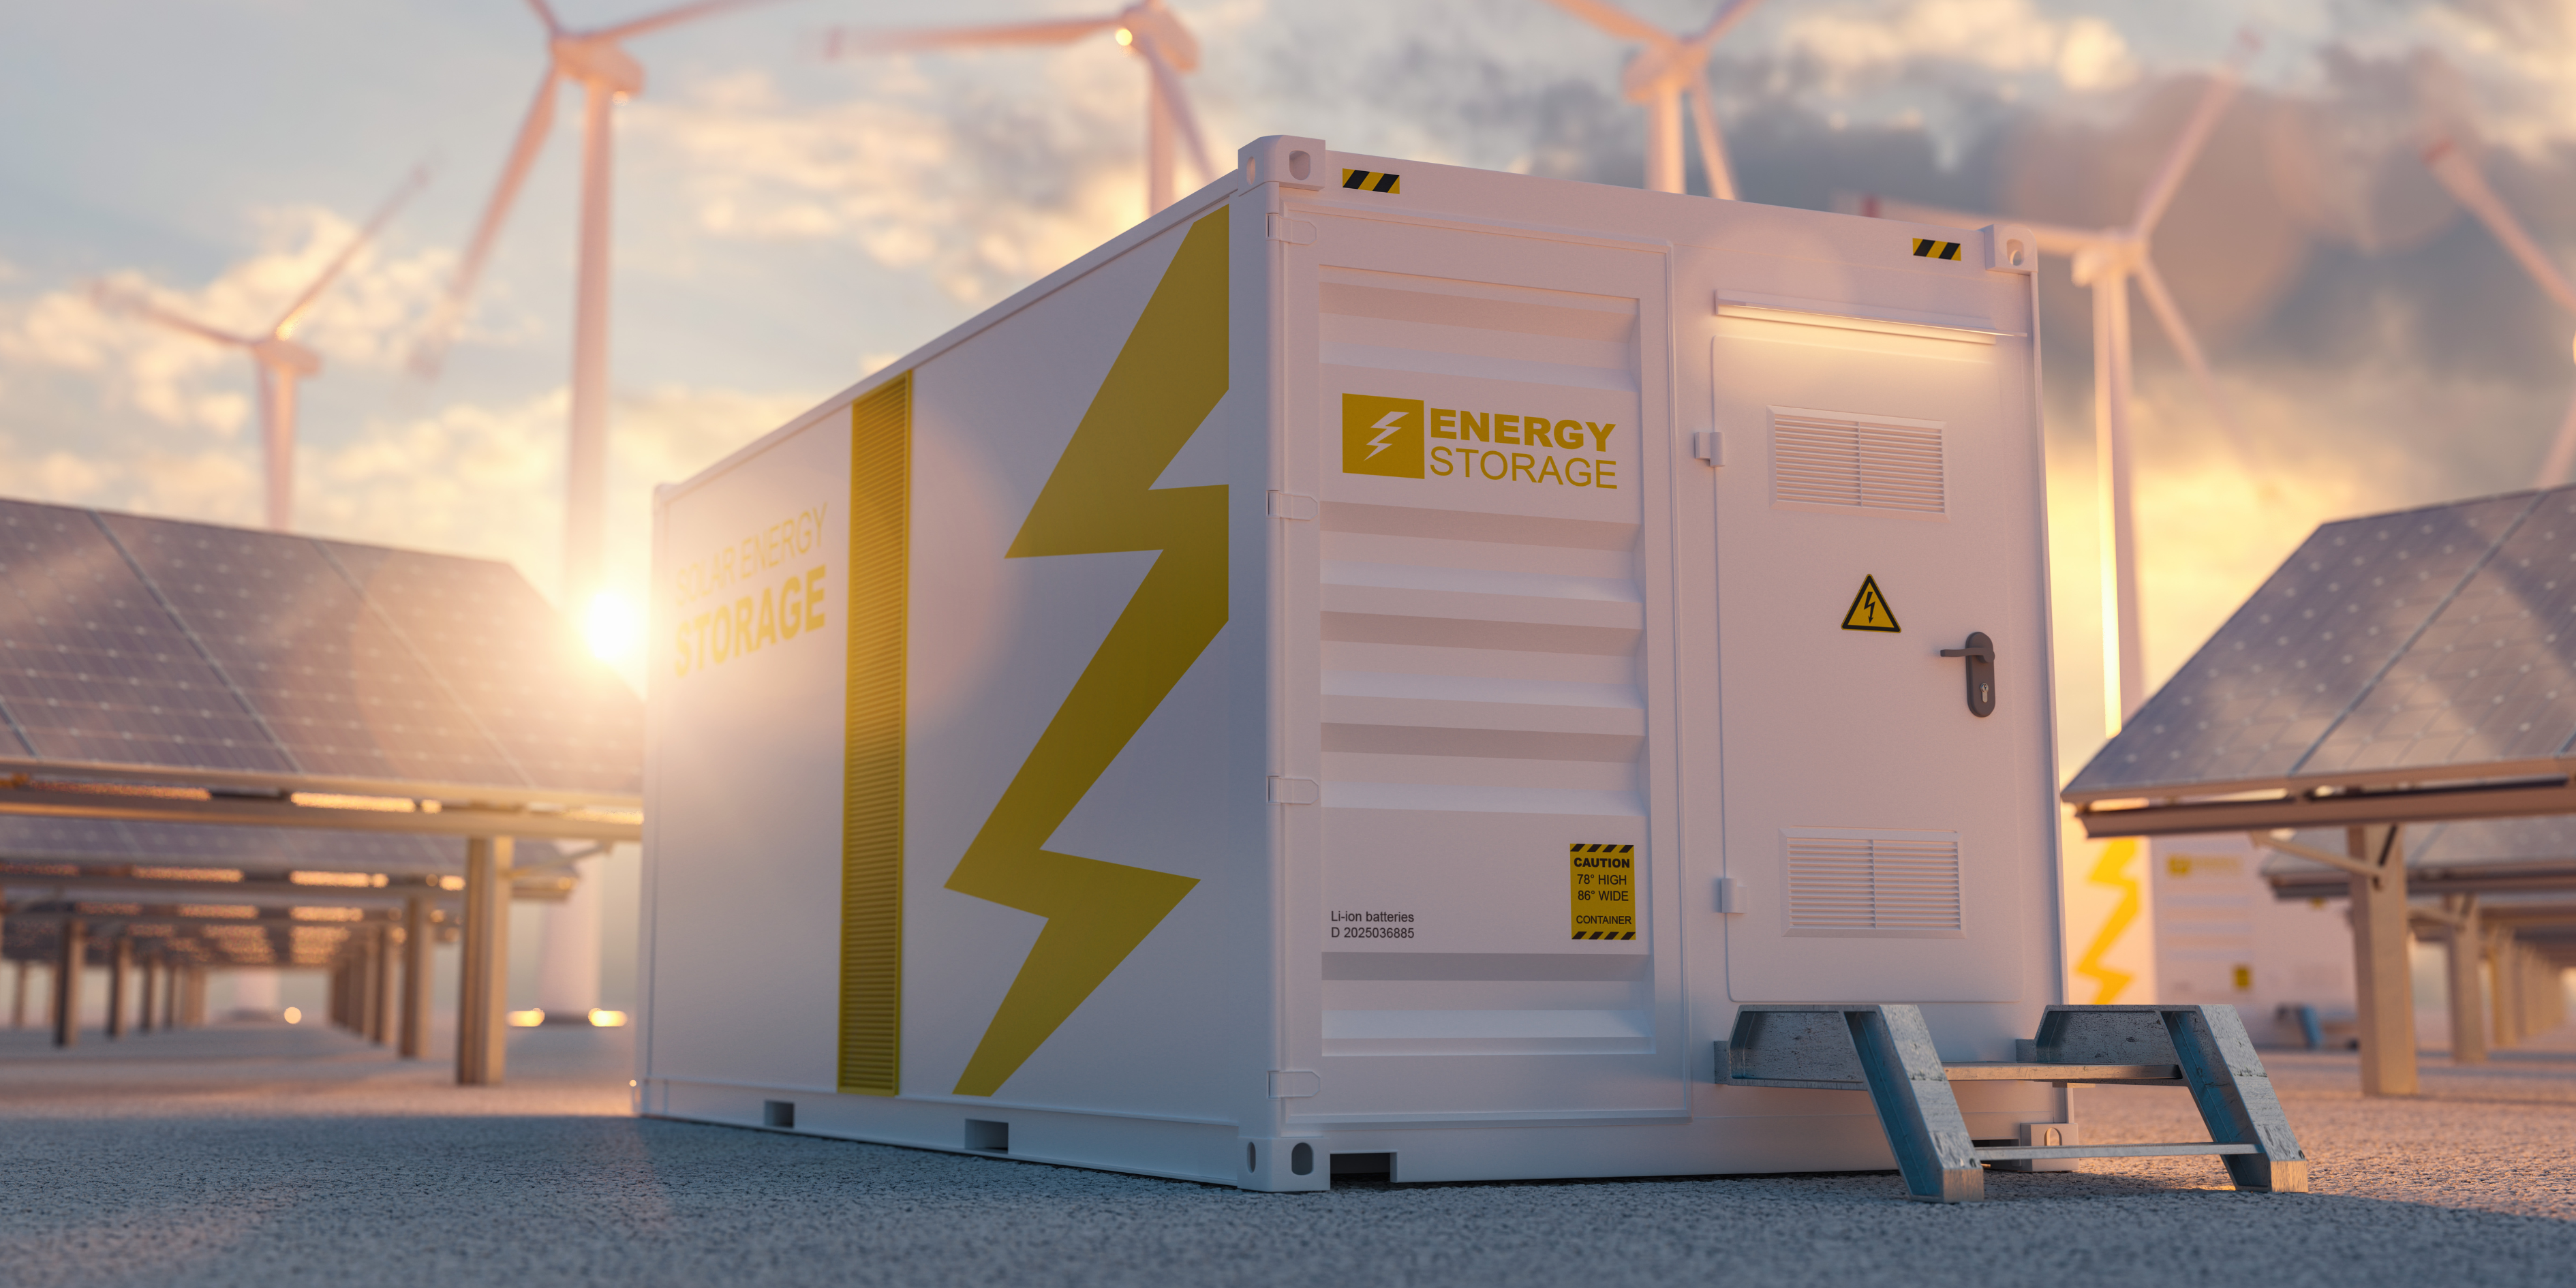
The CSIRO released its Renewable Energy Storage Roadmap at the end of March 2023.

Their modelling suggested that while Australia leads the world in solar generation, and we have reduced emissions significantly, there is still a big task ahead of the country if we are to meet net zero emission targets and maintain affordable and reliable energy to end users. The CSIRO Renewable Energy Storage Roadmap report showed Australia will need significant amounts of storage to meet the transition to renewables.

Storage is the key to integrating renewable energy into the grid and reducing the dependency on coal and gas fired generation. Currently the electricity produced from renewable sources such as wind and solar is intermittent and is not easily dispatched into the grid when it is most needed. Storage allows the renewable energy to be generated when the natural resources are high and dispatching it into the grid when the electricity is needed.

Dispatchable storage is currently available in the grid in the form of pump storage hydro, such as Wivenhoe power station in Queensland and Tumut 3 in NSW. There are also various battery installations located across the NEM.

The dispatch of renewable energy may require different storage technologies to best suit an evolving NEM. Storage comes in various forms from electrochemical storage such as batteries, mechanical storage such as hydro, chemical storage and thermal storage. Each technology has its pros and cons, but a combination of technologies is likely to be required to meet the real time storage volumes and timings of the NEM.

For many years pumped hydro has been seen by governments as the solution to Australia’s energy storage needs, but timing is the limiting factor in this solution.

To enable the transition from coal and gas fired generation to renewables, storage is required now. On a typical day we have excess solar generation resulting in negative spot prices, however over the evening peak as demand increases the supply of renewable drops of coal and gas provide the generation to meet demand. Thermal generation is normally dispatched at prices higher than the cost of renewables resulting in higher spot prices. If storage could be used efficiently the solar energy produced during daylight hours could be used over the evening peak and into the evening resulting in lower electricity prices.

As coal fired generation retires between 2023 and 2035, new dispatchable generation needs to be brought online, the CSIRO report states, development timelines need to be accelerated to bring more projects online by 2030.

Pump storage hydro typically has a lead time of 10 years so either development timelines need to be accelerated or different storage technologies need to be employed in the meantime.

CSIRO chief executive said “there was a need for a “massive increase” in storage capacity to achieve the transition to net zero, with estimates of 11 to 14 gigawatts of additional storage capacity by 2030 alone.

2030 is not far away, to meet the transition targets should industry be focusing on storage rather than generation? Is storage an opportunity to utilise existing infrastructure like old mine pits for pump storage hydro or repurpose retiring thermal power station sites as storage hubs?

Solar and wind are the big losers in latest AEMO MLF forecasts

woman on a windy day

As the electricity market evolves the Australian Energy Market Operator (AEMO) makes assessments of the changing landscape from a transmission and security of supply perspective.

Recently AEMO released its final assessment of Marginal Loss Factors (MLFs). MLF determine how much energy is lost between the generator and the region reference node in each state.

In this next round of MLFs many of the big losers are the intermittent generators. Changes to the grid and the closure of thermal generators have had a detrimental impact on wind and solar farms. Lower MLF’s impact the amount of revenue generators can make.

The final MLF numbers are not as bad as what was published in AEMO draft report providing some positive news for wind and solar developers. Since the draft report new modelling has included the delayed return to service of the Callide C units.

The primary driver for changes in the new MLF forecasts has been changes in availability due to the closure of Liddell, revised return to service dates for Callide C, revised demand forecasts and the increased penetration of solar and wind generation into the grid.

Recent transmission line work has resulted in an increased capacity between Queensland and NSW which means increased flows from Queensland which results in wind and solar projects located in the north of NSW being constrained.

MLF generally gets worse for generators at the end of a long transmission lines, this has resulted in generation in northern NSW being the big loser this year. Some solar farms in the New England region have dropped by over 3%.

While a 3% fall sounds bad, it is not as bad as the MLF for Moree, a 57MW solar farm in western NSW which loses over 20% of its generation by the time it gets to the regional reference node. Previously Moree solar farm had an MLF of 0.8275, this year it is 0.7977.

The return to service of Callide C significantly impacted solar farms in central Queensland, however the delayed return to service has lessened the impact. Daydream, Collinsville, Kidston, and Moura are some of the solar farms most impacted by the new MLFs.

So what does the mean to end users? While we are seeing a rapid increase in renewable generation, the location of this generation is important to the success of a project. If we use the example of Moree where over 20% of the renewable generation does not reach the market then the question has to be, was it built in the correct part of the grid. Many people focus on the size of the project while the volume of electricity produced needs to be of greater importance. Unfavourable MLF will impact the success of the project, will reduce the renewable energy available to the market and potential can leave end users with less renewable energy than what they had signed up for.

Intergovernmental Panel on Climate Change Warning

Edge20202 Drought Landscape

The Intergovernmental Panel on Climate Change (IPCC) released its 6th Assessment Report (AR6) last week, on 20th March. This has been an eight-year assessment and involved over 250 climate scientists.

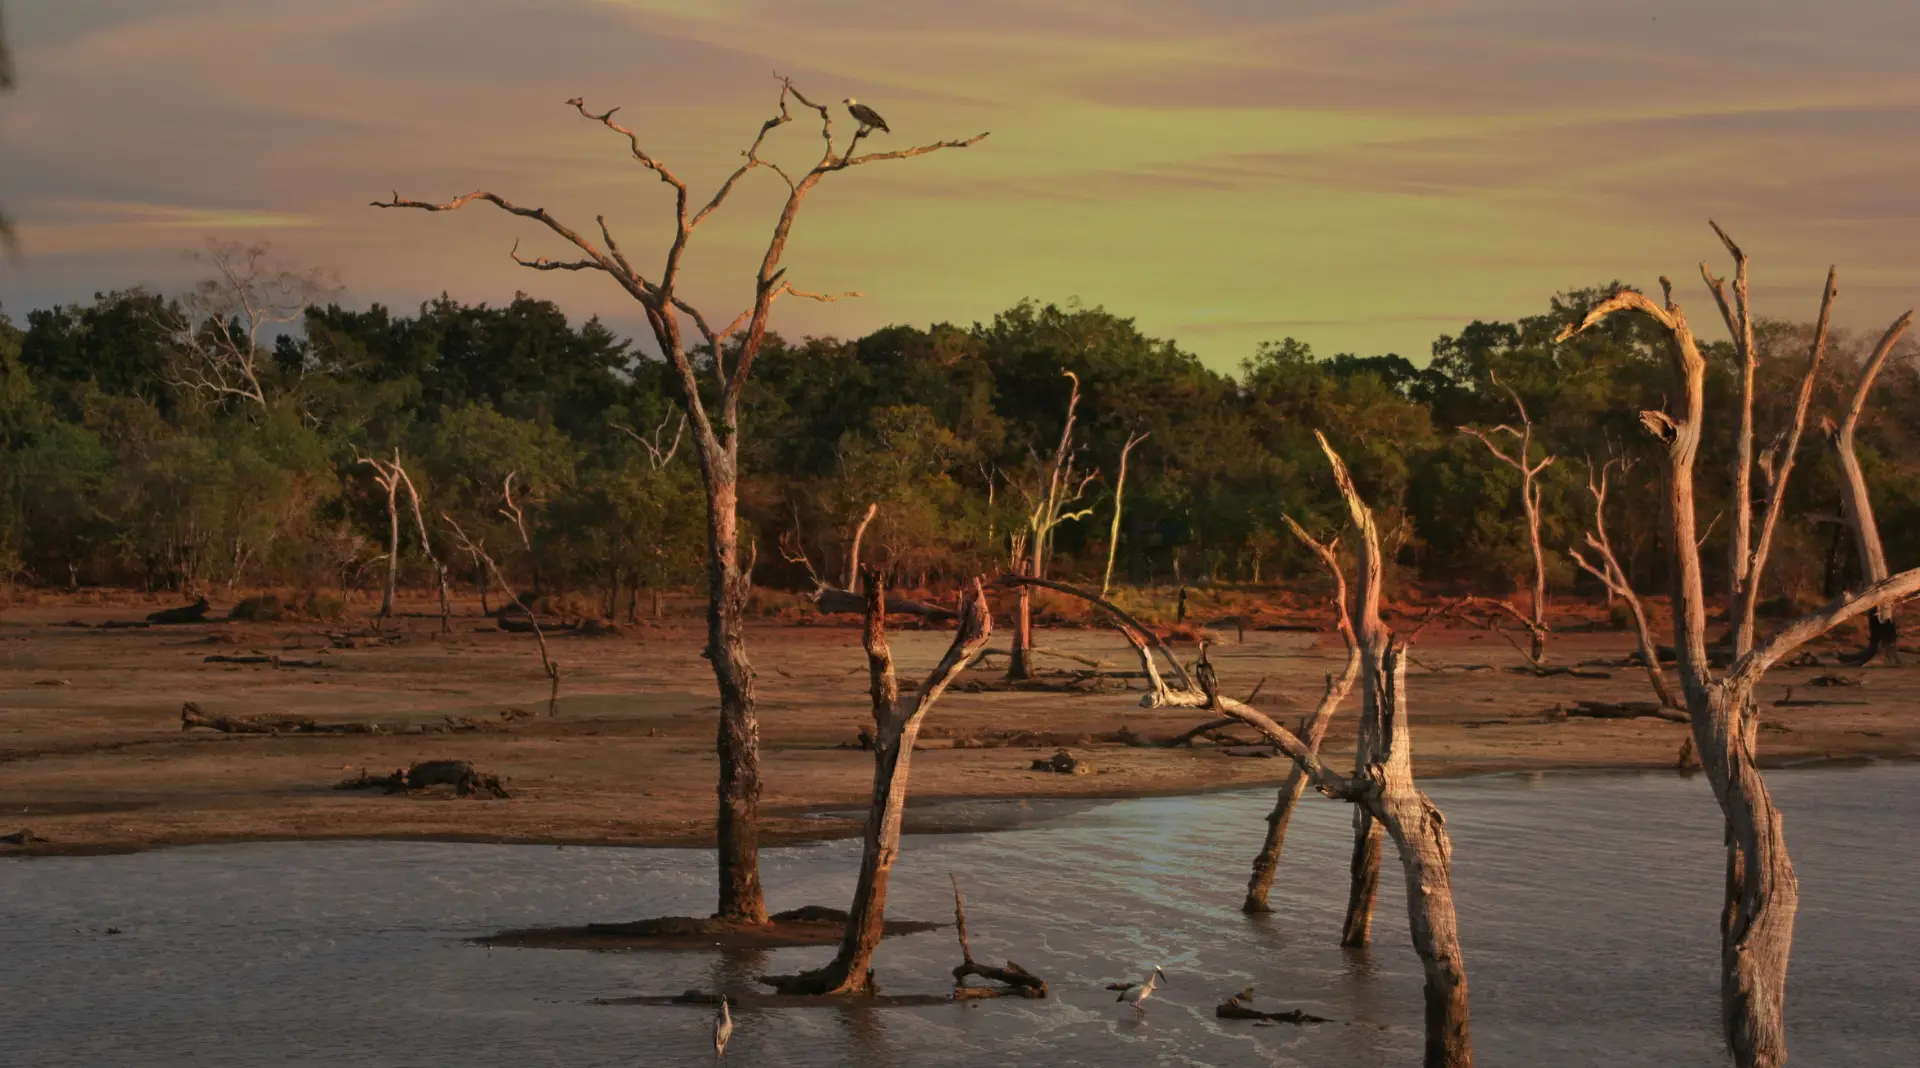
It was as bleak as can be expected and shows the catastrophic impact of increasing greenhouse gasses. The report discusses how we have already reached a 1.1 degrees Celsius increase in global warming and how this is affecting summer arctic ice coverage, ocean acidification and concentrations of Carbon Dioxide.

The focus isn’t just on the current impacts as it reveals the irreversible affects that can occur at as low as a 1.5-degree overshoot, including species extinction and loss of life.

The report is a must read and will be discussed over the next few weeks by many. Interestingly one of the first out of the gate was the UN, whose secretary general has urged nations to abandon the 2050 net-zero target for new stronger 2040 packs. Antonio Guterres is calling for developed nations to phase out coal by 2030 and block new oil or gas extraction. This may, in his opinion, hold us at the 1.5-degree warming cap.

The true test will be in COP28 in the UAE in November and December 2023. However, with the attendance of chair, H.E. Dr Sultan Al Jaber, being the CEO of the 12th largest oil business will likely see a softening of approaches happening there!

What the AR6 does tell us is that we are close to the point of no return. The impacts of climate change are visible and require immediate action. We must react, or it will be irreversible.

Edge2020 have an eye on the energy market, enabling us to support price benefits as well as customer supply and demand agreements. Our clients rely on our experts to ensure they are informed, equipped, and ideally positioned to make the right decisions at the right time. If you could benefit from an expert eye on your energy portfolio, we’d love to meet you. Contact us on: 1800 334 336 or email: info@edge2020.com.au

Dispute over forecasted supply “gap” in East Coast gas market

Gas

AEMO last week released a report which forecasted a supply “gap” on the east coast gas market of up to 33 petajoules on assumptions that the three Queensland LGN ventures exported all their uncontracted gas this year. The report warned of a risk of a gas shortfall in the southern states this winter unless the LNG exporters in Gladstone diverted shipments from export to domestic customers.

Santos’ GLNG joint venture has spoken out against the winter gas shortfall forecasted by AEMO saying that Queensland’s three LNG ventures have committed to make available all the domestic gas expected to be needed this year. AEMO’s forecast did not account for the ventures move to supply an additional 100 terajoules a day of gas this winter.

The joint venture said it had sold more than 15 petajoules of gas to wholesalers, retailers and power generators which will deliver gas between May and September “to alleviate critical peak winter demand in east coast gas and electricity markets”.

GLNG also said AEMO’s data was based on forecasts and the other two Queensland LGN ventures had offered more than 20 petajoules of domestic gas for sale, and there has been no spot LNG export from Gladstone in 2023.

The GLNG chief executive Stephen Harty commented taking all those factors in consideration, “it looks like any potential shortfall has already been fully mitigated.”

On April 1st the Federal Resources Minister is due to start deciding whether to curb LGN exports from Gladstone on a quarterly basis if required to avoid shortfalls in the domestic market.

The reform of the Australian Domestic Gas Security Mechanism (ADGSM) has Queensland LNG exporters and their customers in Asia concerned due to the volumes of gas that Asian nations rely on.

AEMO’s report again has called upon the Albanese government to match support, it has voiced for the role of gas through the energy transition with policy measures. Which would encourage investment in the development of gas resources.

Despite this, the cap implemented on wholesale gas prices and proposed ongoing regulation through “reasonable pricing” provisions on the east coast market has caused gas producers to put several investments in proposed projects on hold. The rules are to be included within the mandatory code of conduct which is expected to be released within the coming weeks.

Industry gas executives are currently arguing for some relaxation of the rules to allow new projects that are needed to meet demand to go ahead, and that barriers to new gas supply investment are removed on the east coast as more gas supply is needed over the coming years. Victoria and NSW state governments are also under pressure to relax restrictions on onshore gas development.

 Edge2020 have an eye on the energy market, enabling us to support price  benefits as well as customer supply and demand agreements. Our clients rely on our experts to ensure they are informed, equipped, and ideally positioned to make the right decisions at the right time. If you could benefit from an expert eye on your energy portfolio, we’d love to meet you. Contact us on: 1800 334 336 or email: info@edge2020.com.au

Energy Market Update – East Coast

Energy market prices

Edge 2020 round up of the last week

Week ending Friday 17th March

QLD

  • QLD prices ranged between -$315.80/MWh and $15,500/MWh for the week ending 17th March 2023, averaging $191.36/MWh.
  • Hot humid weather at the back end of the week resulted in demand increasing and spot prices spiking. Over the evening peak on Thursday spot prices hit the $15,500/MWh market cap while on Friday’s evening peak the price reached $14,500/MWh. Outside these spikes the maximum daily price remained below $400/MWh.
  • Solar output increased across the week as cloud cover reduced. Solar output peaked on Friday at 2,002MW, however there was limited solar available over the evening peaks on Thursday and Friday to suppress spot prices.
  • Wind generation was low during the high spot price events. High spot prices on Thursday and Friday occurred just prior to the evening ramp up of wind. Part of the week saw no wind generation across the state, however output peaked in the early hours of Saturday morning at 443MW. Typical of load swings on intermittent generation by 14:15 the same day wind generation had dropped to less than 2MW.
  • Gas fired generators continue to increase their output. Darling downs hava moved from an intermittent profile to a baseload / peaking hybrid by ramping up generation over the evening peak. Swanbank E continues to operate after midday through until the following morning as seen in previous weeks. Yarwun operated around the clock. During the high price events on Thursday and Friday, Townsville was joined by Roma and Oakey to cover the price spikes.
  • While Wivenhoe continues to operate every evening, the duration is reducing as spot prices decline. Kareeya has joined Barron Gorge in operating throughout the week at 86MW and 66MW respectively. Output from Barron gorge was reduced to zero prior to the evening peak on Thursday due to river safety but had returned to full load by the time the high prices occurred.
  • Coal fired availability remains high despite some reliability issues. During the high price events some generator reduced output, but most remained unchanged. The reason for the sustained high prices on Thursday was a chain conveyor issue at Kogan Creek that took 250MW out of the market. Tarong North was taken out of service during the week and the until returned to service over the weekend.

NSW

  • NSW prices ranged between -$47.00/MWh and $14,506/MWh for the week ending 17th March 2023, increasing the average to $169.43/MWh thanks to several price spikes on Thursday and Friday.
  • Solar output continues to drop again this week, peaking slightly lower than last week at 2,357MW. Similarly, to Queensland there was minimal solar output during the spot price spike on Thursday and Friday.
  • Wind generation was also low across NSW during the high spot price events. High spot prices on Thursday and Friday occurred just after wind output dropped by ~800MW. Output peaked in the early hours of Monday morning at 1,492MW. Prior to the high prices on Thursday output was also high reaching 1,440MW only hours before the spot price spikes.
  • Tallawarra returned to base load operation this week with Colongra, Smithfield and Uranquinity providing the occasional evening peak generation. All gas units ran over the evening peaks on Thursday and Friday when the high spot prices occurred.
  • Coal fired availability remains high this week with no unplanned unit outages. All coal fired units are now cycling their units across the day to reduce exposure to negative prices but are increasing output over the evening peak and into the night when spot prices are higher. The price spike was partially caused by Vales Point 5 being out of service.

SA

  • SA prices ranged between -$982.42/MWh and $1,004.70/MWh for the week ending 17th March 2023, averaging $67.97/MWh.
  • Solar generation was heavily constrained again this week due to negatives prices and system security concerns, solar peaked at 414MW with output ranging between 360MW and 410MW for the back end of the week.
  • High levels of wind generation during solar hours resulted in solar being constrained. Wind output peaked at the end of the working week at 1,173MW significantly lower than previous weeks. Wind output also dropped below 20MW for part of the week, but this was when solar output was high. High spot prices continue to occur when wind generation is low.
  • Torrens Island B and Pelican point continued to share the synchronous generation across the week. Dry creek, Quarantine and Osbourne also ran over the higher priced intervals throughout the week.

VIC

  • VIC prices ranged between -$995.78/MWh and $357.49/MWh for the week ending 17th March 2023, averaging $57.54/MWh.
  • Solar generation was heavily constrained due to negative spot prices but still managed to peak at 803MW and ranged between 700MW and 760MW across most of the week apart from over the weekend when output was constrained to 450MW.
  • Wind generation in Victoria was sporadic peaking at 2,763MW but dropping to less than 5MW at some parts of the week. Similar to South Australia, higher spot prices continue to occur when wind generation is low.
  • Hydro generation remained unchanged to last week with across the week with Murray, Eildon and Dartmouth only operating during the higher priced parts of the day.
  • Availability of coal fired generation in Victoria remains unchanged with no outages.

Retrofitting old power station sites with renewable generation

wind turbine

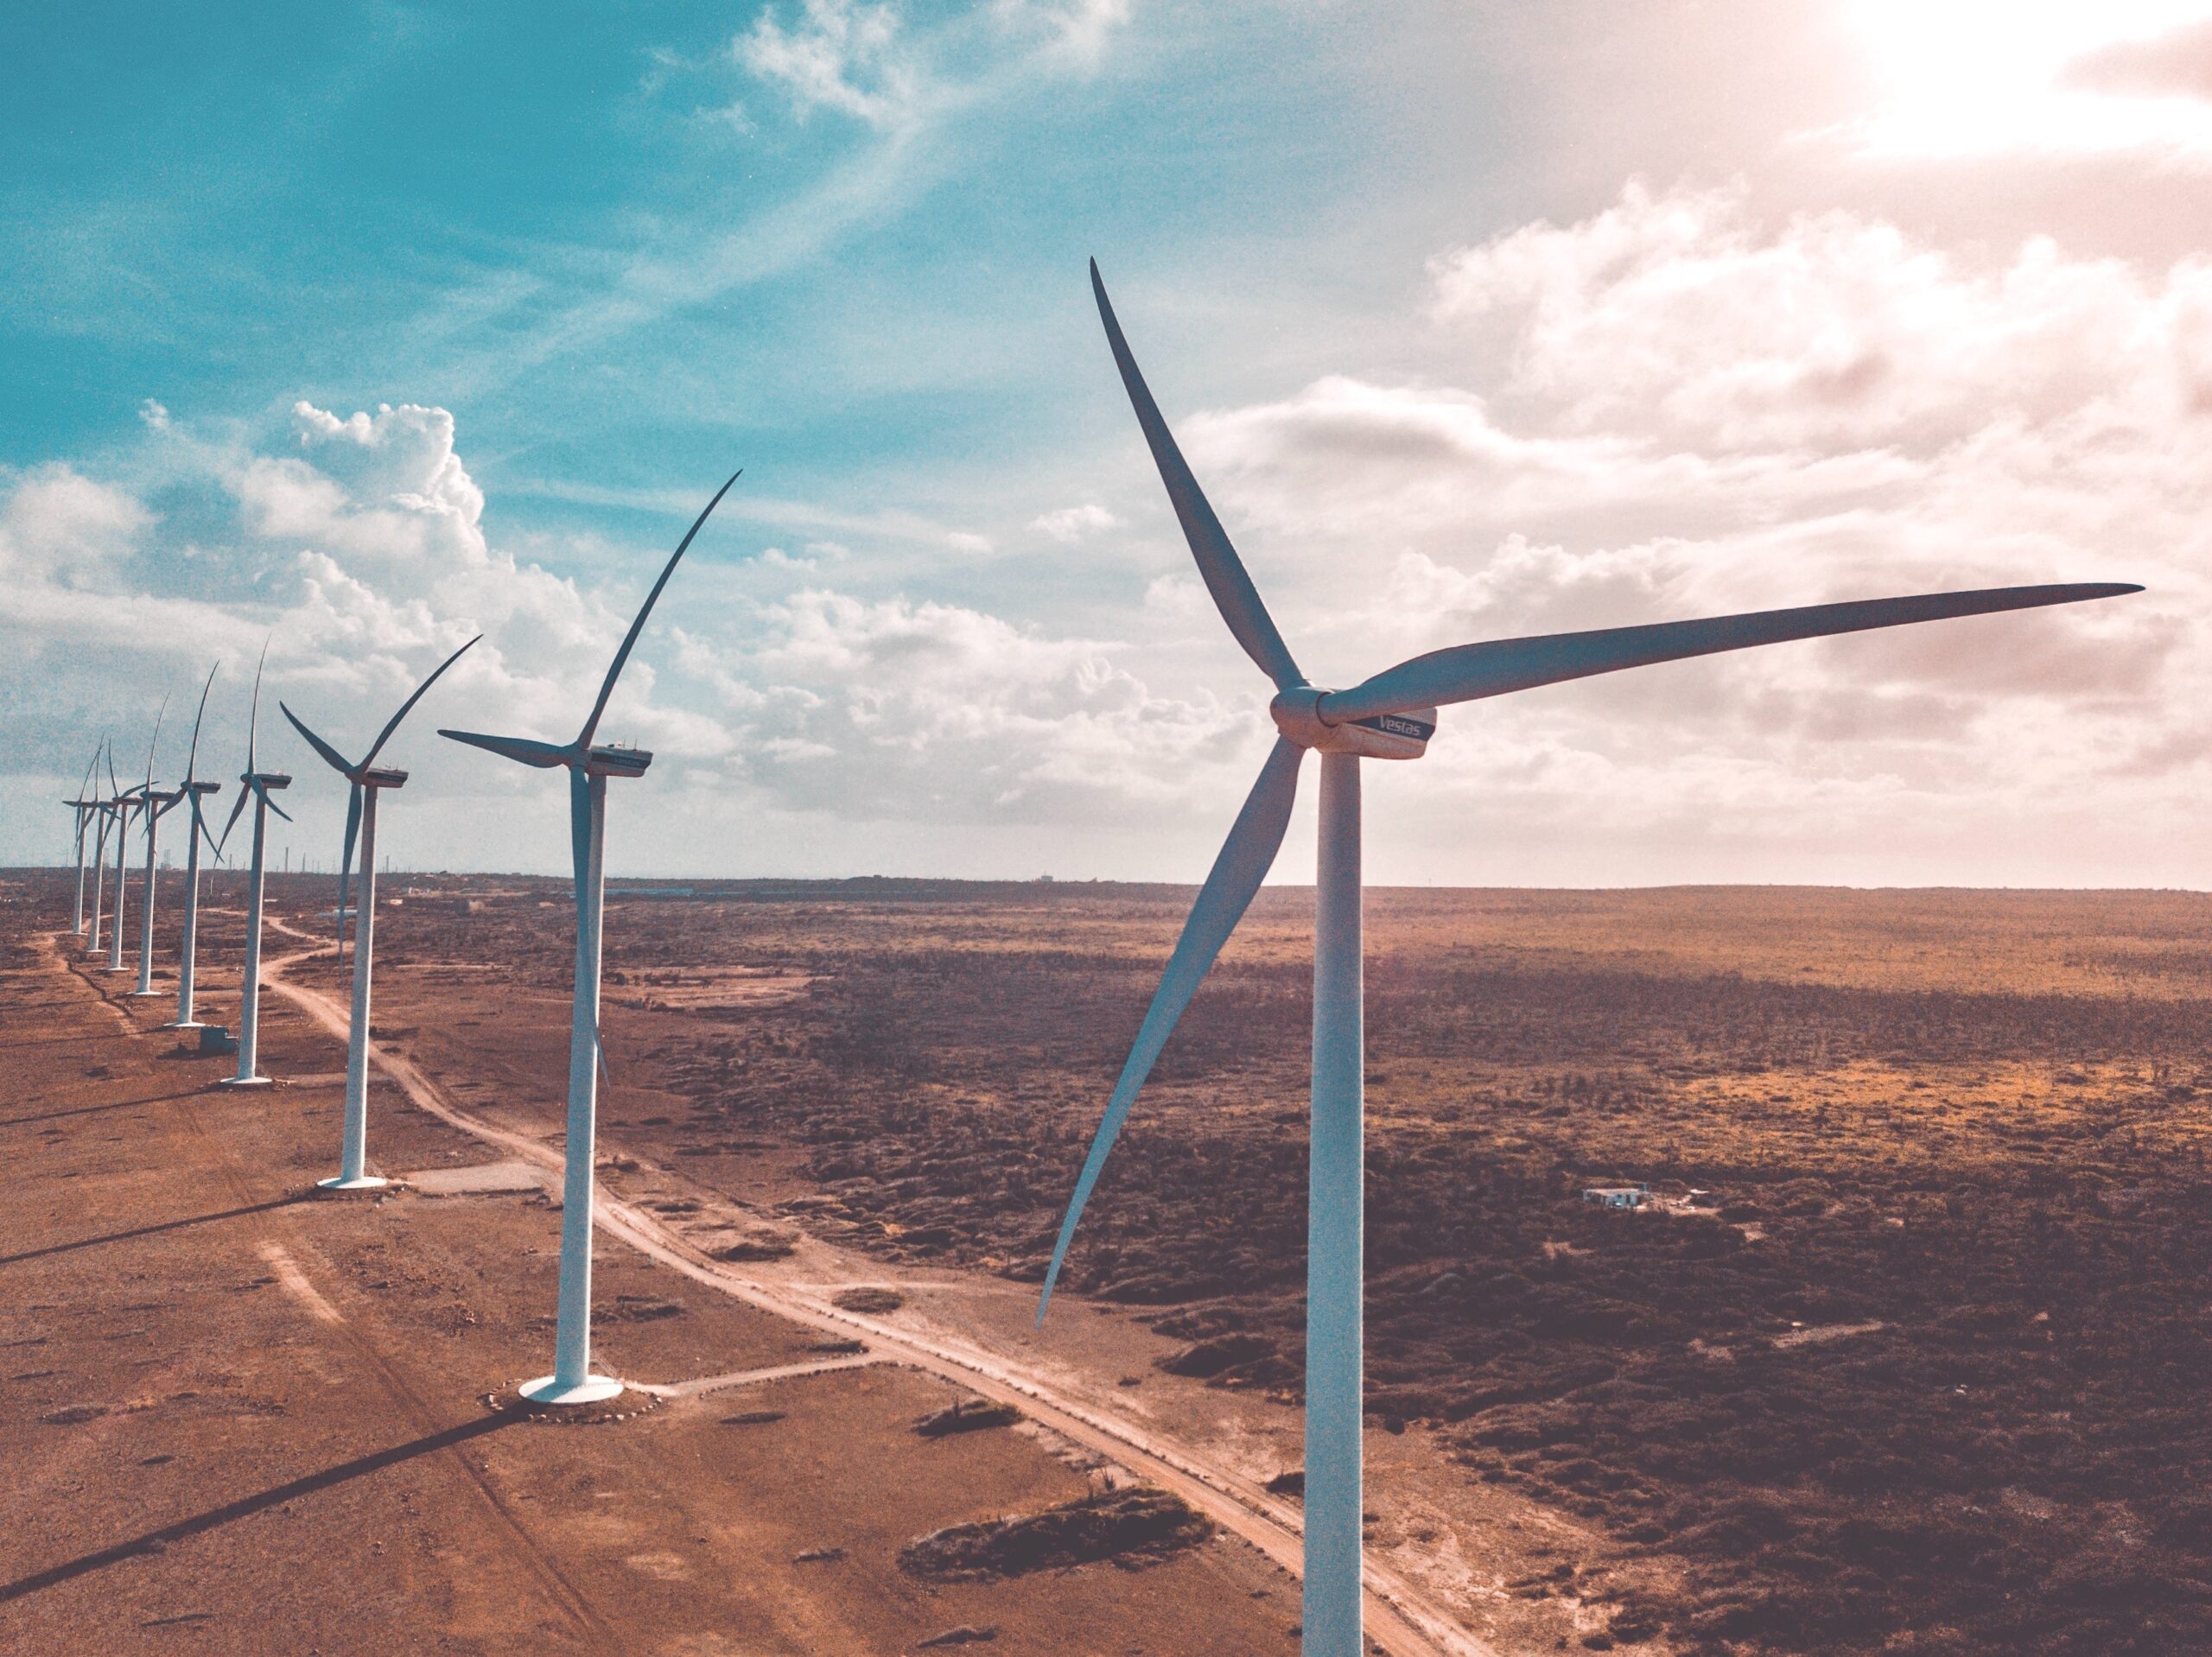
As coal fired generation retires the logical solution would be for renwable generation developers to use the existing connection points to install either new generation or energy storage. Generally, these locations have the best transmission infrastructure close by and have favourable loss factors.

Increasingly renewable developers are finding it hard to obtain favourable locations to build new projects particularly for solar and wind. Most developers prefer sites next to transmission infrastructure, but more and more renewable developers are struggling to find sites with good solar or wind potential. The wind sector is most influenced by site selection with the majority of the high wind yielding sites already developed.

The question is, do developers now look at redeveloping existing generation sites rather than start with a greenfield site? While there are benefits of a brownfield site, the registration and connection process of a new project is as arduous as developing a whole new new site. Additional connection studies would need to be undertaken and new projects would need to meet more stringent approval processes.

As developers are forced to develop low yielding sites the output of the projects drops and costs increase, so developing an older site may be beneficial if yield is significantly better.

The earlier wind farms were built in the late 1990’s and are now entering the final years of their life. Are these locations ideal for the next generation of wind farms or will developers opt for new sites?

Overseas data suggests repowering an existing site with new more efficient and larger wind turbines has its benefits. At this stage no Australian wind farms have been repowered.

The Australian Energy Market Commission (AEMC) estimates the average wind farm is 15 years old however some are close to 30 years old. The early wind farms are located where the wind resource was seen to be the best.

With offshore wind the next big thing in the industry will we also see the development of larger more efficient wind farms on the same ground as the industry pioneers?

At Edge 2020 keeping our customers informed on the energy market is a top priority for us. As the world shifts towards a more sustainable future, we are committed to playing our part by procuring from renewable energy sources, whilst continuing to secure cost-effective energy solutions for our customers. If your business is interested in wholesale or retail renewable PPAs we’d love to help you. Contact us on: 1800 334 336 or email: info@edge2020.com.au

Future investment in the grid not the cheapest option

At the end of February, Energy Ministers agreed to go down the path of a voluntary congestion relief market with priority access. Most developers and advocates of renewable energy have supported the energy minister’s decision to proceed with planning for a congestion relief market, but Australian Energy Market Operator (AEMO) have released initial costings showed it could cost more than $300M.

Previously the Energy Security Board (ESB) proposed a connection fee model, the voluntary congestion relief model has been estimated to cost up to 30 times more than the connection fee model.

The new ESB boss and current chair of the rule maker, the Australian Energy Market Commission (AEMC), recently said “the more expensive voluntary model chosen to help fix transmission congestion on the grid from the influx of renewables will ultimately deliver more benefits for consumers and result in fewer carbon emissions”.

The NEM is controlled by the National Electricity Market’s dispatch engine (NEMDE), this computer system dispatches all the scheduled units across the NEM and optimises across all inputs including bid prices, constraints, supply, and demand. This is an aging system and would require replacement to operate the ESB’s proposed connection fee model.

The Australian Financial Review revealed the congestion model would cost $76M, much higher than the $19M congestion model initially preferred by the ESB, however there are cost savings in not replacing NEMDE.

The ESB’s cost-benefit analysis of the capacity relief market would result in a net benefit of between $2.1B and $5.9B over 20 years. Apart from the economic benefits the model would reduce emissions by 23Mt over the 20 years.

Transmission congestion has increased over the last 5 to 10 years as more renewable and storage projects connect to the existing network. The market operator AEMO has been highlighting the need for new network capacity to accommodate the 127GW of renewable energy expected to enter the grid by 2050 in various planning publications. While renewable energy will displace the majority of coal and gas generation an extra 63GW of transmission capacity are still needed to facilitate the 127GW of renewables and storage likely to connect to the grid.

Under the current market rules generation from new projects can curtail the output of existing power station resulting in existing projects exporting less power. While this model works well for system security it does not work well for developing an industry and providing certainty for developers.

The ESB’s preferred option of voluntary congestion would allow developers to trade congestion relief with priority given to existing projects over new projects when accessing the grid during times congestion.

The final model will be delivered to the energy ministers by mid-2023 and is likely to be in place in 2027.

Despite being the best solution over the long-term existing energy users will pay the cost in the short term.

 Edge2020 have an eye on the energy market, enabling us to support price  benefits as well as customer supply and demand agreements. Our clients rely on our experts to ensure they are informed, equipped, and ideally positioned to make the right decisions at the right time. If you could benefit from an expert eye on your energy portfolio, we’d love to meet you. Contact us on: 1800 334 336 or email: info@edge2020.com.au


2022 Electricity Statement of Opportunities (ESOO) update

map of australia

Today the Australian Energy Market Operator (AEMO) has released an update to the 2022 Electricity Statement of Opportunities (ESOO) report due to significant new information available in the market.

The ESOO provides data to inform the decision making processes of market participants, new investors, and jurisdictional bodies as they assess opportunities in the national electricity market over a 10 year outlook.

Today’s update contained material changes in availability including:
  • AGLs decision to bring forward the closure of Torren Island B (800MW) in South Australia from 2035 to 2026.
  • Origin Energy delaying the closure of Osborne Power station (180MW) in South Australia from December 2023 to 2026.
  • Bolivar Power Station gas fired power station has changed to committed status adding 123MW of supply to South Australia.
  • Snowy Hydro have confirmed a 1-year delay in Snowy 2.0 with completion now expected in December 2027.
  • Snowy Hydro have confirmed a 1-year delay in Kurri Kurri Power station (660MW) with completion now expected in December 2024.
  • The 850MW Waratah Super Battery Project in New South Wales is expected to be operational from late 2025.
  • Additional 1326MW of wind generation and 461MW of battery energy storage systems.

As a result of these changes, the market operator has called for urgent investment in generation, long duration storage and transmission to achieve reliability requirements over the next decade.

The reliability assessment is measured in expected unserved energy (USE) as a percentage of energy demand. The ESSO assessed against the reliability standard of 0.002% USE and the Interim Reliability Measure (IRM) of 0.0006% USE.

The ESOO highlighted reliability gaps in South Australia from 2023/24 and Victoria from 2024/25 which have now been filled by new gas fired generation, wind project, battery developments and the delayed retirement of existing gas fired generation outline above.

AEMO CEO said “the update reiterates the critical need for timely investment in generation, long duration storage and transmission to fill forecast reliability gaps as Australia moves rapidly away from its traditional dependency on coal generation” “Reliability gaps begin to emerge against the Interim Reliability Measure from 2025 onwards. These gaps widen until all mainland states in the NEM are forecast to breach the reliability standard from 2027 onwards, with at least five coal power stations totalling approximately 13 per cent of the NEM’s total capacity expected to retire.

The update to the ESOO provides the market with opportunities to fill the reliability gap but what happens if reliability standards drop. Historically lower reliability this has resulted in higher spot prices that flow though to end users.

Edge2020 have an eye on the energy market, enabling us to support price benefits as well as customer supply and demand agreements. Our clients rely on our experts to ensure they are informed, equipped, and ideally positioned to make the right decisions at the right time. If you could benefit from an expert eye on your energy portfolio, we’d love to meet you. Contact us on 1800 334 336 or email: info@edge2020.com.au


Storage, the future for AGL

During the record high energy prices experienced last winter combined with a rapid transition to renewable energy saw AGL Energy return a half year loss of $1B due to outages at Loy Yang A and their Hunter Valley power plant.

Despite this, AGL’s new chief executive Damien Nicks has an optimistic outlook for the second half, after a “challenged” first half. As a result of this drop in underlying profits, investors are worried about how AGL will fund its decarbonisation and whether the transition to renewable energy will occur fast enough, reinforcing the huge challenge faced by Australia’s energy-intensive industries.

AGL announced last year to committing to a $20B plan to develop 12GW of renewable energy by 2036 following pressures from shareholders and activists. A major component of the 12GW of renewables is 5GW to 7GW of firming capacity assets such as batteries and pump hydro. AGL are expecting the firming capacity assets to generate higher returns (7% to 11%) compared to wind and solar (6% and 8.5%).

Despite the decline in underlying profits, “Having a clearly endorsed strategy now, and now we have a board and management team in place means that the banks look at our transition plan and strongly support that,” Mr Nicks said. “That is a key part of us getting access to that capital.” The projects will be funded through cash flow, corporate equity, debt, and project debt.

While this may be a good strategy for AGL to improve shareholder value, it will be interesting to see how the strategy goes meeting Australia’s ambitious climate goals.

AEMO’s emergency powers prevent blackouts during high peak demand

candle due to blackout

Last Friday demand was forecast to break the all-time record of 10,119MW seen in March 2022. AEMO’s pre dispatch forecasting was showing demand peaking at 10,656MW but by 5:30 it had fallen short with Queensland’s demand peaking at 9,750MW.

With a record peak demand forecast due to high temperatures and humidity, AEMO utilised its emergency powers to prevent blackouts across Queensland. As the evening peak approached on Friday, AEMO intervened in the market and at 4:25pm  they enabled Reliability and Emergency Reserve Trader (RERT).

Between 5.30pm and 9.30pm members of the RERT panel reduced consumption on site or increased on site generation to reduce the overall QLD demand. These panel members are compensated by AEMO under individual arrangements if their services are used.

Prior to the dispatching of RERT, AEMO had sent lack of reserve notices to the market to encourage generators to offer more supply. Also, the QLD energy minister said the system would be tight, but he was confident of avoiding blackouts.

As previously discussed, Queensland relies on wind and solar generation to provide clean cheap electricity, but it is currently reliant on coal fired generation to provide the reliable backup when the sun has gone down, and the wind is not blowing.

Currently on a “normal” day demand is easily filled with a combination of solar, wind, gas and coal but on extreme day like last Friday the system becomes more dependent on scheduled generation like gas and coal fired powered stations.

Following the failure at Callide C3 and Callide C4 the state is down 840MW of availability and on extreme days this generation can mean the difference between “normal” prices and the lights staying on and very high prices and the possibility of load shedding.

If it was not for AEMO stepping in, demand may have increased, and spot prices may have certainly capped out close to $15,500/MWh. While very high prices are not good for end users, they are a signal for investment.

If high spot prices occur, it may encourage increased participation in the market and new generation being built but currently the uptake of renewable projects and storage has been slow.

Queensland has high ambitions to replace the coal fleet with renewable and storage but days like last Friday only reinforce that coal fired generation still plays a significant part in the security and price outcomes in the QLD market.

Edge2020 have an eye on the energy market, enabling us to support price  benefits as well as customer supply and demand agreements. Our clients rely on our experts to ensure they are informed, equipped, and ideally positioned to make the right decisions at the right time. If you could benefit from an expert eye on your energy portfolio, we’d love to meet you. Contact us on: 1800 334 336 or email: info@edge2020.com.au