AEMO’s emergency powers prevent blackouts during high peak demand

candle due to blackout

Last Friday demand was forecast to break the all-time record of 10,119MW seen in March 2022. AEMO’s pre dispatch forecasting was showing demand peaking at 10,656MW but by 5:30 it had fallen short with Queensland’s demand peaking at 9,750MW.

With a record peak demand forecast due to high temperatures and humidity, AEMO utilised its emergency powers to prevent blackouts across Queensland. As the evening peak approached on Friday, AEMO intervened in the market and at 4:25pm  they enabled Reliability and Emergency Reserve Trader (RERT).

Between 5.30pm and 9.30pm members of the RERT panel reduced consumption on site or increased on site generation to reduce the overall QLD demand. These panel members are compensated by AEMO under individual arrangements if their services are used.

Prior to the dispatching of RERT, AEMO had sent lack of reserve notices to the market to encourage generators to offer more supply. Also, the QLD energy minister said the system would be tight, but he was confident of avoiding blackouts.

As previously discussed, Queensland relies on wind and solar generation to provide clean cheap electricity, but it is currently reliant on coal fired generation to provide the reliable backup when the sun has gone down, and the wind is not blowing.

Currently on a “normal” day demand is easily filled with a combination of solar, wind, gas and coal but on extreme day like last Friday the system becomes more dependent on scheduled generation like gas and coal fired powered stations.

Following the failure at Callide C3 and Callide C4 the state is down 840MW of availability and on extreme days this generation can mean the difference between “normal” prices and the lights staying on and very high prices and the possibility of load shedding.

If it was not for AEMO stepping in, demand may have increased, and spot prices may have certainly capped out close to $15,500/MWh. While very high prices are not good for end users, they are a signal for investment.

If high spot prices occur, it may encourage increased participation in the market and new generation being built but currently the uptake of renewable projects and storage has been slow.

Queensland has high ambitions to replace the coal fleet with renewable and storage but days like last Friday only reinforce that coal fired generation still plays a significant part in the security and price outcomes in the QLD market.

Edge2020 have an eye on the energy market, enabling us to support price  benefits as well as customer supply and demand agreements. Our clients rely on our experts to ensure they are informed, equipped, and ideally positioned to make the right decisions at the right time. If you could benefit from an expert eye on your energy portfolio, we’d love to meet you. Contact us on: 1800 334 336 or email: info@edge2020.com.au

Coal and gas moves to renewables and storage

Renewable generators with battery storage

With Enel X announcing the installation of battery storage systems in shopping centres in Melbourne and on the NSW central coast, this year may see a shift in the energy market as we transition from coal and gas to renewables and storage.

Recently AEMO’s CEO Daniel Westerman said, ‘even after factoring the cost of new transmission lines, wind and solar remain by far the cheapest forms of new power generation’.

Key federal policies have underpinned the need to progress an increase in renewable energy. Growth in renewable energy is dependent on the growth of storage to be fully utilised and the need for greater transmission infrastructure is required to link the projects to the end users.

The announcement of the Net-zero emissions target of 43% of 2005 levels by 2030 have pushed other mechanisms to also ramp up across the country. The key federal mechanism is the Safeguard Mechanism, which targets the emissions reduction for Australia’s largest emitting facilities. In line with the Safeguard mechanism the 82% renewables energy target in the National Electricity Market (NEM) by 2030 is also incentivising renewable generation. As both these drivers will require more renewable energy to be rolled out to offset the thermal generation, more storage will be required to compensate for the intermittency of renewable generation and an increase in transmission lines will be required to connect the renewable energy projects with storage and end users.

AEMO has for many years been looking at a fundamental shift in generation, transmission and energy usage. AEMO is now focusing on firming, Electric vehicles and the regulatory framework to enable these changes to occur.

In recent years we have regularly seen that the NEM has the potential to operate with very high levels of renewables, but the limiting factor still remains that thermal generation provides reliability and system security when the wind is not blowing or the sun is not shining. At the end of December, South Australia produced 104% of its demand with renewable energy and exported the extra electricity to neighbouring regions.

With most states striving for high renewable energy targets, Victoria is hoping to reach 95% renewables by 2035 and Queensland has increased its target to 80% renewables by 2035.

With the recent volatility in the overseas energy markets, in which Australia is a pivotal player in due to the large quantities of coal and gas we export, there is now a greater incentive to shift away from thermal generation due to the volatility and high prices.

AEMO reports show there is currently 21GW of new projects undergoing connection assessment and they expect 5GW of new capacity to be added during FY2023, in addition to the 4GW currently operating.

To assist this influx in renewable generation ARENA granted $176m in December 2022 to fast track 8 new battery projects to bring in 2.0GW/4.2GWh of storage. The plan is to triple the battery storage across the NEM by 2025.

Over the next year we will also see more transmission lines connecting the nation as more renewable energy zones are connected to the load centres under the Rewiring the Nation policy.

The first transmission projects to receive Rewiring the Nation funding were announced following the October 2022 Federal budget. Recently funded projects include the VNI NSW-Victoria interconnect, Marinus Link and various NSW transmission projects connecting the renewable energy zones. This funding will assist in building the transmission lines over the next 10 years.

If your business is interested in wholesale or retail renewable PPAs we’d love to help you. Contact us on: 1800 334 336 or email: info@edge2020.com.au

Coal price caps result in high compensation but lower forward prices

Last week reports emerged that one coal fired power station could receive up to $450M in federal compensation as a result of the price cap on coal. Under the new legislation, coal fired generators are compensated for the cost of coal they have locked in at prices above the $125/t cap.

The coal price cap is likely to be higher than the coal currently locked in by many coal fired power stations, however some power stations are exposed to higher priced coal. Under the coal price cap mechanism, generators must bid into the market at a price inline with coal procured below the coal price cap. Generators that are exposed to coal prices above the coal price cap will not be able to dispatch their unit unless generating uneconomically. The compensation is designed to level the playing field allowing the units with fuel costs above the coal cap to continue to supply power and assist in system security.

Based on the current price of coal, compensation for Queensland’s Gladstone power station could reach $450m. The compensation will be split between the Queensland and federal governments on a 50/50 basis while the $125/t coal price cap is in place. The total compensation amount will vary depending on the amount of coal procured at prices above $125/t.

Many may argue that generators with high costs should be forced up the bid stack and not be compensated for high fuel costs. While stations like Gladstone may not have the benefit of low coal prices the station is currently crucial to system security in Queensland. Gladstone is not the only coal fired power station to receive compensation. In NSW, Origin’s Eraring power station will also receive compensation.

The coal cap legislation forbids coal producers from selling coal to domestic generators above the price cap and electricity generators must dispatch into the NEM at costs that reflects the cost of coal procured below the coal cap. The changes in bidding have resulted in the forward market electricity prices dramatically falling with the likelihood of future contract prices to level off in line with new long run marginal costs.

Below is a summary by state of recent activity:

QLD
  • QLD prices ranged between -$78.70/MWh and $270.00/MWh for the 2 weeks ending 31st December 2022, averaging $67.59/MWh.
  • QLD Q422 prices ranged between -$122.18/MWh and $15,500.00/MWh , averaging $120.24/MWh.
  • Solar output fluctuated across the period with output peaking close to previous weeks at 2,106MW, during the negative spot period the output was economically curtailed. Cloud cover also reduced output.
  • Apart from Christmas eve, wind generation displayed a consistent negative correlation with solar. Output peaked at 685MW leading up to Christmas then reduced to a normal maximum of 450MW for the remainder of the year.
  • Gas fired generation including Swanbank E, Townsville, Roma and Condamine covered the evening peaks with the exception of Yarwun that operated 24/7.
  • Wivenhoe hydro generation reflected the gas generators by covering the evening peaks and evening while Kareeya continued to generate around the clock.
  • Coal fired availability remained high with Gladstone taking a unit off over the Christmas / New Years break, Kogan creek returned to service on 20th December and remains online. Millmerran 1 came offline on the 30th and remains offline. All other operating as expected.
NSW
  • NSW prices ranged between -$69.20MWh and $223.54/MWh for the 2 weeks ending 31st December 2022, averaging $73.60/MWh.
  • NSW Q422 prices ranged between -$120.00/MWh and $15,500.00/MWh, averaging $115.66/MWh.
  • Most price spikes are now being capped below $149/MWh lower than the previous $300/MWh cap, this is likely as a result of the cap on gas.
  • Solar output fluctuated across the period with output peaking close to previous weeks at 2,367MW, during the negative spot period the output was economically curtailed. Cloud cover also reduced output.
  • Wind output dropped as we approached Christmas then increased to peak at 1,436MW at the end of the year.
  • Tallawarra was the only gas turbine to generate over the Christmas break due to relatively low prices.
  • Coal fired availability remained high despite various movement in units, Bayswater returned to service on the 20th but Eraring and Vales Point both took units offline over Christmas. Eraring returned to service on the 2nd January but the Vales point unit remains offline.
SA
  • SA prices ranged between -$605.41/MWh and $4,027.21/MWh for the for the 2 weeks ending 31st December 2022, averaging $41.19/MWh.
  • SA Q422 prices ranged between -$1,000.00/MWh and $15,500.00/MWh , averaging $63.67/MWh.
  • Solar generation peaked at 435MW on the last day of the year but maximums averaged 350MW. Negative spot prices caused units to be constrained.
  • Wind generation was sporadic reaching a high of 1,915MW but also dropped to less than 10MW occasionally. The SA market spiked on two occasions, both times the output from wind generation dropped significantly.
  • Thermal generators continue to operate over the evening peak when spot prices are generally higher, however they are operating during other parts of the day when spot prices are high. Torrens Island is operating all hours of the day, but Quarantine, Barkers inlet, Dry creek and Pelican Point have reduce run times as they focus on higher price periods.
VIC
  • VIC prices ranged between -$141.51/MWh and $228.44/MWh for the 2 weeks ending 31st December 2022, averaging $36.17/MWh.
  • VIC Q422 prices ranged between -$996.18/MWh and $584.31/MWh , averaging $62.86/MWh.
  • Solar generation was heavily constrained due to negative prices, solar output peaked at 797MW.
  • Wind generation was sporadic reaching a high of 2,871MW but also dropped to less than 5MW occasionally.
  • Hydro generation continues with its strategy of only operating Murray over the evening peaks, with Dartmouth, Eildon and Bogong adding additional generation when required. Hydro generation continues to increase during the high price periods. Hydro generation across Victoria and NSW has been used to keep a cap on spot prices, however the market is now capping around $140/MWh rather than the traditional $300/MWh cap price.
  • Yallourn continues to have various issues over the Christmas break with unit tripping followed by a fail return to service of unit 1, by the end of the year Yallourn was operating with 3 units. The Loy Yang A & B station operated consistently across the last 2 weeks of the year, continuing with the strategy of reducing generation during low price periods.

At Edge2020 we help our customers navigate the ever-changing energy landscape and to ensure the proactive and accurate delivery of advisory, account, and portfolio management services and associated outcomes. If you could benefit from an expert eye on your energy portfolio, we’d love to meet you. Contact us on: 1800 334 336 or email: info@edge2020.com.au

Energy users wait for lower price after intervention bill

Following the passing of the energy reform bill in Canberra last Thursday, end users are waiting to see when the price of gas and electricity starts to match the caps imposed in the wholesale market.

Prior to the passing of the intervention bill, end users were looking at gas deals above $30/GJ. Now a cap of $12/GJ has been imposed, what will be the offer price to gas consumers? AGL have been quoted,

“as soon as the legislation is passed, they will try to get some better offers”

The legalisation covers uncontracted wholesale gas and capping this portion of the market at $12/GJ may not see the benefits flow through to end users.

Large end users of gas have the option to procure gas from the spot market, this segment of the market is not covered by the $12/GJ cap so prices in the gas spot market are likely to be higher than $12/GJ. So, with coal prices peaking again above $300/t is there the potential for gas to now be the transitional fuel to renewables?

The war in Ukraine has influenced the transition to renewables and potentially speed the process up worldwide. European countries are now less likely to take significant volumes of gas from Russia, so they will be looking at alternative fuel sources. As a result of the gas supply issues out of Russia, some European countries are reviving their coal fired generation fleet while they transition to renewables.

While international gas prices remain high, Australian gas producers have been very vocal in leaving the domestic gas market alone and let it work as intended. They argue the gas market will fix itself, higher prices will signal the investment in new supply, resulting in lower long term energy prices.

The gas market is currently proving to be very profitable for producers at the expense of end users. A recent report from the regulators exposed that the majority of offers for 2023 gas were over $30/GJ and a report out of AEMO shows the cost of production is $9.50/GJ or below. With a potential continuation of the $20/GJ profit for gas producers they will be pushing to make gas the transitional fuel and push out the coal industry.oc

While the intervention bill is designed to be in place for 12 months, the ACCC has flagged an extension to the reasonable pricing framework saying they,

“would be expected to be required until domestic gas prices are reflective of the underlying costs of production and that there is sufficient supply at these prices”.

At Edge2020 we will continue to monitor both the gas and electricity markets to understand the impacts these market caps will have on the prices offered to end users.

Edge2020 have an eye on the energy market, enabling us to support price  benefits as well as customer supply and demand agreements. Our clients rely on our experts to ensure they are informed, equipped, and ideally positioned to make the right decisions at the right time. If you could benefit from an expert eye on your energy portfolio, we’d love to meet you. Contact us on: 1800 334 336 or email: info@edge2020.com.au

Federal and State Government agree to power bill

On Friday National cabinet met and agreed on the states introducing a cap on wholesale gas and coal. The temporary cap will be set at $12/GJ for gas and $125/t on coal. The caps will not enforce on export contracts therefore not limiting the opportunities on high international prices.

During the meeting it was agreed that the states would sort out the coal cap and the federal government would change laws to legislate the $12/GJ cap on domestic gas. As the caps are focused on the domestic market, they will only have a small impact on the profitability of producers. It is anticipated that only 4% of gas and 10% of coal will be affected by the cap, the remaining volumes will be exposed to international markets.

As the states have been tasked with implementing the cap it is likely they will go down different routes in achieving the same outcomes. The simplest state to implement the changes will be Queensland as the government still owns and control 80% of the coal fired generation fleet. Queensland will likely use its directive powers and instruct its government owned corporations (GOCs) to dispatch the coal assets below specific prices. NSW will likely use changes in law to cap the price for the state.

In line with the price caps, national cabinet also discussed an assistance package to lower the impact on families and business as a result of high inflation and high commodity prices.

The cap mechanism will be used for uncontracted gas and coal, this may have limited impacts on generators as the majority of coal and gas has already been produced under longer term contracts with strike price below the proposed caps.

At this stage it is unlikely that the mechanism will be in place until February despite federal politicians being recalled to Canberra on Thursday to discuss the issue. While the bill will get the support of the House of representatives it is expected the Greens will put pressure on the Government in the Senate to limit any compensation for the coal producers.

When the futures market opened on Monday morning it was evident the traders expect the caps to flow into the market. Both QLD and NSW futures dropped by $20/MWh for later dated quarters and over $30/MWh for Q123.

Edge2020 have an eye on the energy market, enabling us to support customer supply and demand agreements. Our clients rely on our experts to ensure they are informed, equipped, and ideally positioned to make the right decisions at the right time. If you could benefit from an expert eye on your energy portfolio, we’d love to meet you. Contact us on: 1800 334 336 or email: info@edge2020.com.au

Slow growth in renewable energy

The Clean Energy Council (CEC) recently released to its members their quarterly renewable projects report, which showed only one renewable project, Stubbo solar farm, reached financial close in Q3-2022. The 400MW Stubbo solar farm situated in NSW demonstrates the slowing of the renewable industry. Renewable project growth has slowed by almost 30% compared to Q2 -2022 and over 60% slower than Q3 -2021.

While politicians are talking up the prospects of a renewable energy driven industry to reduce the impact of climate change, the reality reaching the 44GW target outlined by the federal government may be hard to achieve at the current rate of growth. To meet the 44GW target by 2030, a significant number of new wind, solar and storage projects need to come online. If these projects do not happen, the retiring coal generators cannot be replaced and may be forced to remain online.

The CEC says investment in renewable is at an all-time low. Quarterly investment has dropped almost 60% to $418M.

As well as the federal announcements, QLD and VIC have also announced ambitious renewable targets linked to the transition from coal fired generation.

Recently the Federal Minster for Climate Change and Energy estimated Australia must install 22,000 500-watt solar panels every day for eight years, along with 40 seven-megawatt wind turbines every month, backed by at least 10,000 kilometres of additional transmission lines to meet its commitment to reduce emissions by 43 per cent by 2030. This is what is required for us to reach a target of 82% renewables by 2030.

While only one project reached financial close last quarter, three projects started construction during Q3-2022 with an increase of installed capacity of 902MW. As well as another two projects that completed commissioning during Q3-2022.

The Stubbo solar farm project also included a storage device, being the only storage device to reach financial close.

Currently, there are 247 financially committed renewable projects in Australia, with 221 under construction and 169 undergoing commissioning.

The CEC notes that the desire to build new solar, wind, pumped hydro, and transmission lines are meeting opposition from local communities. For example, projects like the Chalumbin wind farm, situated next to World Heritage-listed rainforests in North Queensland are reducing the number of wind turbines they are installing by half due to the concerns from the local community. Another example being part of the Queensland government’s renewable plan which included the construction of the largest pump storage hydro station near Mackay. Mackay locals later found out one of their towns has the potential to be flooded as part of the mega project.

With ambitious renewable targets being spruced by politicians and businesses actively seeking renewable energy to aid in the decarbonisation of their operations, the question of where and when these projects will be delivered needs to be asked. The majority of people support the transition to renewables but obviously not in their backyard.


The South Australian island and running on renewables

On November 12th a series of storms passed through South Australia that had the potential to black out the whole state, as had previously happened in 2016. Whilst parts of South Australia did lose power, it was far less dramatic than the last weather event due to a significant amount of work that has been undertaken by AEMO to build a more secure grid since the 2016 blackouts.

In 2017 AEMO released a review of the events that had blacked out the state; the main cause was of course the extreme weather that had knocked over transmission lines as well as some wind farms not meeting protection standards. Similar to 2016, it was destructive storms that passed through South Australia and damaged the network on the 12th November. At 4:59 PM, the market was notified of a significant power system event due to the tripping of multiple transmission lines. Both elements on the Tailem Bend – Southeast 275kV transmission line had tripped. Some transmission towers were damaged and had fallen over, resulting in the South Australian grid being disconnected from the NEM. On Saturday at 6:03 PM, AEMO notified the market that South Australia had been reconnected to the NEM after the 275kV transmission line at Tailem Bend was returned to service.

During events like this AEMO invokes its power to manage system security; however, this time, it went a step further and constrained off-rooftop PV to maintain a secure level of Distributed PV (DPV) generation. AEMO switched off as many rooftop PV installations as possible during the middle of the day, a rare occurrence known as “islanding” of the state grid to maintain stability, designed to keep the DPV below the secure threshold. PV generation is not as easily controlled as other sources. At times South Australia can meet all domestic demand for power via rooftop solar and sends surplus to Victoria but this cannot be managed in an islanded state, therefore requiring the curtailment of the rooftop PV allowing AEMO to manage scheduled and semi-scheduled generation assets to maintain system security.

Smart metering is required to enable the shutting down of rooftop PV systems, however not all South Australian PV systems can be controlled remotely as they have older inverters. This resulted in only 50% of systems being curtailed. Over time as more rooftop PV systems are installed using smart inverters, there will be more control of their output. Currently, AEMO can control 100MW of PV generation, but during the recent event, it also used voltage control to trip off a further 300MW of rooftop PV out of approximately 1,000MW of installed capacity.

The South Australian network has now been re-synchronised to the NEM, and electricity is flowing between South Australia and the other states of the NEM as before. While South Australia was isolated from the NEM for a week, South Australia was powered by wind and solar for up to two-thirds of its electricity demand, with gas providing the difference. System stability is a delicate balance between the supply of electricity, the types of generators providing the electricity and the electricity demand from end users. This time, part of the solution was to encourage end users to consume more electricity, enabling a higher generation level. Before the curtailment, South Australia was supplied by over two-thirds of its demand via renewable generation.

While high levels of renewable generation are good for keeping electricity costs down, the savings can be eroded by high-frequency control costs and the need for a more expensive gas-fired generation to fill the gap when the sun is not shining, and the wind is not blowing.

Edge2020 have an eye on the energy market, enabling us to support customer supply and demand agreements. Our clients rely on our experts to ensure they are informed, equipped, and ideally positioned to make the right decisions at the right time. If you could benefit from an expert eye on your energy portfolio, we’d love to meet you. Contact us on: 1800 334 336 or email: info@edge2020.com.au

Market Report – Quarter 3 2022

Overview of National Electricity Market (NEM) Quarter 3 2022

International drivers continue to increase gas and electricity prices across the NEM. The main reason for this increase has been and continues to be the tight supply / demand balance resulting from Gas flow restriction in Europe, associated with the war in Ukraine. The reduced flow of gas in Europe has resulted in a greater demand for Australian gas that in turn has put cost pressures on Australian gas market. Higher priced gas then links into to Australian electricity market, leading to higher spot and futures electricity prices.

For Q322 electricity spot prices averaged $216/MWh across the (NEM). The Q322 average spot price of electricity was close to matching the all time record of $264/MWh that occurred in Q222. Interestingly, the average price of electricity for Q322 was more than three times higher than the same quarter the previous year. In Q321the average price of electricity was $58/MWh.

NEM operational demand increased by 2.6% or 559MW to 22,414 MW compared with the same quarter last year. We also saw demand increase for the first time in Q3 since 2015. Households and businesses used more electricity from the grid as a result of their underlying electricity consumption increasing and the output from their rooftop Photovoltaic systems (PV) not generating as much as normal due to cloudy conditions.

High spot prices occurred at the start of Q322 on the back of record high spot prices seen across Q222. The July NEM monthly average of $360/MWh was $23/MWh higher than the June 2022 average of $337/MWh. Later on in the quarter spot prices fell with August Electricity prices averaging $145/MWh across the NEM. Until this year QLD, NSW, VIC and TAS have not recorded a Q3 average electricity price of over $100/MWh. South Australia reached this milestone in Q316 at $119/MWh.

Historically Q3 is not a volatile quarter, but this year it is different, Q322 saw 24% of the dispatch intervals with a price over $300/MWh. This is on the back of the previous quarter, in July prices exceeded $300/MWh 61% of the time, the highest monthly proportion since  the start of NEM. Many intervals saw prices in the $300-$500/MWh range resulting in spot prices moving above the historical price cap threshold of $300/MWh.

Below are the drivers that elevated spot prices and volatility in Q322.

  • A reliance on thermal generation (coal and gas fired) with higher fuel cost due to the increased demand for these resources internationally.
  • Hydro generation setting prices at elevated levels due to limited water supply and bids adjusted to meet revised trading strategies.
  • An increase in demand as consumption increased and rooftop PV generation reduced due to cloudy skies.
  • Price volatility significantly increased the average spot price of electricity with large jumps in spot price due to the distribution of generation offers within the bid stack. The market operator stacks all offers from lowest to highest to build the bid stack. The spot price for a trading interval is the offer price of the marginal unit at the required generation level to meet demand. The bid stack ranges from -$1,000 to $15,500/MWh. During August the spot price reached over $1,000/MWh as generators withdrew generation for technical and economic reasons.
  • With higher average electricity prices we also saw less negative electricity prices across the NEM. In the previous year we experienced negative prices 17% of the time but for Q3 we have only experienced negative prices 9% of the time.

Weather

A La Niña event was declared across the NEM increasing the likelihood of above average winter-spring rainfall across much of northern and eastern Australia, while a negative Indian Ocean Dipole (IOD) event increased the likelihood of rainfall across southern and eastern Australia. Q322 was very wet, with many sites recording their wettest July on record. Wet weather continued across Q3 with September’s rainfall being the fifth highest on record across Australia. Temperatures at the beginning of the quarter were below average in many parts of Victoria and Tasmania and above average minimum temperatures occurred across south-east Australia.

La Niña resulted in wet and cloudy conditions impacting solar generation and the supply of coal to power stations, in additon to the export market resulting in higher prices.

Electricity Demand

As outlined above the NEM demand has changed since the same time last year, the below chart shows this graphically.


The chart below shows how the demand in Q3 has increased in recent years.


The charts below also show the slow down in the growth on rooftop PV and change in operational demand.


NEM Spot Prices

NEM spot prices have increased significantly and have reached unprecedented levels.

The cost of the underlying fuels for generators has led to these increases. Coal and gas prices are at all time highs due to international demands leading to a high cost of generation. The chart shows the correlation between East coast gas price and the price of electricity. Coal also corelated closely to the cost of generation and a resulting electricity spot price.

Prices have also increased as renewables generation (solar, wind and hydro) is lower due to cloud cover reducing solar, low storage levels reducing hydro generation and hence it bids in at higher prices. There have also been large swings in the output from wind which results in spot market volatility.


Generation and Offer Prices

Gas contributed the most to supply in Q322 and as result of the high cost of gas this has influenced the average spot price.The lower volume of generation from coal was a result of bidding behaviour withdrawing thermal capacity and intermittent generation like solar and wind taking a larger market share.

A lower capacity factor for coal generation has resulted in coal fired availability moving higher up the bid stack resulting in coal fired generation needing to dispatch at higher spot prices to meet their long run average costs.


Emissions

NEM emissions intensities declined this quarter slightly to 0.6 tCO2-e/MWh. Total emissions were 0.2% lower than Q321.

Australian Stock Exchange (ASX)

The futures market was influenced by a higher spot market, gas prices and the delays experienced with large scale renewables, a slowing in the rooftop PV market and climate conditions likely to reduce the output from solar generation.

The future price of electricity traded on the ASX for Calendar 2023 (Cal 23) continued to increase in price across the quarter in the four NEM mainland regions. Cal 23 New South Wales futures finished the quarter at $232/MWh, with Queensland at $224/MWh, South Australia at $193/MWh and Victoria at $157/MWh.


Credits: All charts in this report are sourced from AEMO


Edge 2020 offer market leading services for business energy users who require a resource they can trust. We help you navigate the ever-changing energy landscape and ensure the proactive and accurate delivery of advisory, account, and portfolio management services and associated outcomes. Reach out, we would love to assist you: info@edge2020.com.au or call on:1800 334 336


International oil price fluctuations and the electricity market reacts

Organization of the Petroleum Exporting Countries (OPEC+), the intergovernmental organisation of 23 oil exporting nations mainly in the Middle East and Africa (with the original core 13 holding most power) is the body which is responsible for around 40% of the world’s oil production. In early October this group agreed to slash the output of crude oil by 2 million barrels a day. To put this in perspective Saudi Arabia produces on average 10 million barrels per day of the current, already reduced, 42 million barrels coming from the OPEC+ nations and this 2-million-barrel reduction translates to about 2% of the global oil supply. It is also worth noting in 2016 when OPEC became OPEC+ Russia joined the organisation and has held a strong voice ever since.

This reduction in production, shows a sign of deepening rifts between the Middle East and the US, and the cynic in me says may be more than slightly linked to the upcoming US mid-term elections where the democrats are already looking weaker than their GOP counterparts – not that those countries have ever influenced an American election in the past *Cough Trump Cough*.  But regardless of motives these new production limits will come into place in November and the impending reduction in production has repercussions which flowed through the broader Australian and global energy markets including oil, coal and gas.

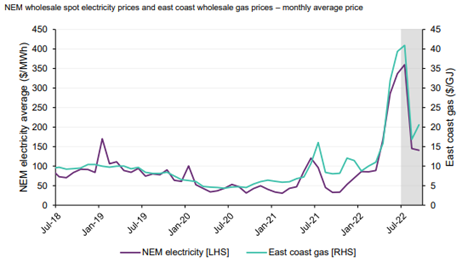
Australian electricity prices are strongly correlated with the international crude oil price, particularly in QLD and NSW, the impact of Brent crude futures hitting a high of $US93.39 on Monday caused a rally on the Australian electricity market, with the Q123 QLD price rising 20%, as the effect of this increase translated to the domestic electricity market. Brent Crude being the international oil benchmark price.

However, OPEC+ are not the only drivers of the oil price, especially WTI and Brent prices. The US dollar, on the back of a fear of a global recession has been strengthening which has dampened the demand for their oil on the international stage. (Consider the FX implications of a strong dollar, if you are buying from Europe the same amount of crude oil now costs more as the number of Euros to achieve the same dollar amount has increased). So, a reduction in demand of America Oil due to FX and reduction in export from OPEC+ can only move the needle up in price regardless of source.

We also cannot ignore the ongoing COVID implications in Asia, especially China. Their glut of demand has not returned to anywhere near the pre-pandemic levels and as such that demand is not translating into a price war to ensure delivery of the commodity. Conversely to above this is actually holding prices lower and reducing the impact of the OPEC+ reduction.

But there is no ignoring the elephant in the room, the impact of Russia’s invasion of the Ukraine, which has led to global increases in commodity costs, has also acted as a buffer to the oil price despite the recession fears. As many countries imposed their own moral code and refused to buy Russian oil, other sources could benefit from the increase in demand. By the end of September this year Russian oil was trading at $20/barrel cheaper than its Brent counterpart. Some less scrupulous countries such as India and China, sought to benefit from this price differential and ignored the sanctions coming from the West and are now taking at least half of Russia’s oil exports. Further, Russia has now overtaken Saudi Arabia to be the biggest exporter of oil into China. Therefore, could the cut in reduction be as simple as the rest of OPEC+ looking to balance the loss in demand from the East by passing inflated prices to the West?

But back to Australia, we are obviously a commodity rich nation, however with our internal thirst for electricity and therefore generation linked heavily to the export price of that commodity, we are subject to these international fluctuations also. As the price of the oil increases, the global demand from that commodity shifts to other sources. Our gas and coal price domestically are therefore linked heavily to the price that exporters can achieve if they send our home-grown coal and gas abroad. So as the demand shifts from oil, to gas or coal so does the price. Hence the correlation described above with Brent rising and that coming into our domestic market.

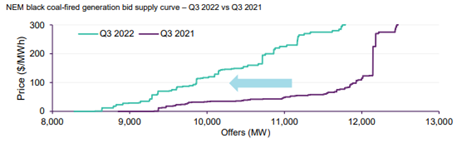
Then for fun lets add in our own pressures, we are expecting another La Nina this year, last year’s summer La Nina brought low solar output coupled with flooding, wet coal stockpiles and just-in-time delivery delays due to the tracks being flooded and trains not able to deliver.

We also have an economy which is having increasing inflationary pressures. These inflation increases will flow onto the interest rates (including the interbank rates) and therefore commodity prices. How? Well, a retail return is based on 2 main drivers, network and wholesale costs, the latter we have covered above. But in isolation network costs will also increase, due to the inflation increasing the nominal value of the asset and therefore the increasing value of the debt as the interest rates increase also.

Further any investment required to transition our market to greener fuels will also be increased, as the levelized cost of electricity for these new assets is also increased due to cost of capital and higher interest rates feeding through. As such the ‘Energy transition’ will now cost more.

There is also a regulatory driver, with an impending price cap increase being fast tracked, this will allow system stability to flow through, as gas won’t withdraw at the $300/MWh cap as this looks likely to be increased to $500/MWh. Therefore, does that become the new ceiling of our market?

There is an old idiom that when China sneezes Asia catches a cold, I unfortunately think this now needs to be broadened to when any imbalance occurs the ripples will be felt globally.

The balance is so tight that without some easing of any fundamentals the shocks will continue. AEMO are acknowledging this, but despite acknowledging the issues they are desperately clinging to the hope a capacity market will be the silver bullet to system stability, backed by large synchronous generators, not that they have any benefit from that mechanism. However, I cannot agree, point in fact I point you to the black outs in the UK on August 9th 2019, a market which has had a capacity mechanism for many years yet in a moment of system instability these ‘capacity assets’ could do nothing and they experienced a blackout for 45 minutes and over 1 million people were affected.

What this means for us is without regulation around bidding behaviour based on cost of generation from hedges not advantageous forward prices, we are looking at another summer with uncertainty and volatility based on international fundamentals pulling the Australian market along for the ride.

Coal state leading the way to renewables

Last week in Queensland the weather was perfect. It was perfect for those at the beach during school holidays but also perfect for renewable energy.

As everyone in the NEM knows, Queensland is better known for its dominant coal generation, at times pumping out 80% of Queensland’s power supply. With the clear skies and just enough wind, Queensland became the renewable state.

Last week, Queensland’s demand was supplied by over 66% renewable energy. Solar was the largest contributor of renewable energy with wind coming in second.

Previously we have seen the state powered by 50% renewables but the 66% hurdle is a positive message for end users impacted by the reliability and behaviour of the thermal generators.

The Palaszczuk government announced their 10-year-energy plan which involved introducing two new pumped hydro mega-projects in regional Queensland and a green conversion of its coal-fired power generators. The Palaszczuk government also has recently announced upping the target of 50% renewable energy by 2030 to 70% by 2032.

Despite this increase in target, until recent years coal has remained dominant in Queensland. The government has all but ruled out the early retirement of any of the state-owned coal-fired power stations, following pressure from unions. Some could say the slow uptake in renewables is due to supply chain issues, registration, connection and construction delays while other may say it results from the government owning a significant portion of the existing thermal and non-thermal generation that is reaping high returns due to the spot and forward energy prices.

AEMO’s recent Integrated System Plan (ISP) shows the NEM will contain over 80% capacity coming from renewables by 2030. While the renewable industry in Queensland has been slow to grow recently more federal funding is being used to rewire the nation by connecting renewable energy zones (REZ) to end users. With the rewiring in place developers are less restricted in building and financing renewable projects and producing renewable energy.

Industry is also looking for renewable energy to meet their sustainability targets which leads to a market for new renewable projects. AEMO indicated there are thousands of MWs of renewable projects waiting to be built.

If Queensland followed the latest ISP, the state would require an additional 30GW of energy from renewable sources and the storage required to make it useful for end users when the sun does not shine, or the wind does not blow.

Today’s announcement by the premier outlined the $62B plan for Queensland energy and jobs. The plan includes:

  • 70% of Queensland’s energy supply from renewables by 2032
  • 80% of Queensland’s energy supply from renewables by 2035
  • Two new pumped hydros at Pioneer/Burdekin and Borumba Dam by 2035
  • A new Queensland SuperGrid connecting solar, wind, battery and hydrogen generators across the State
  • Unlocking 22GW of new renewable capacity – giving Queensland 8 times the current level of renewables
  • Publicly owned coal fired-power stations to convert to clean energy hubs to transition to, for example, hydrogen power, with jobs guarantees for workers
  • Queensland’s publicly-owned coal-fired power stations to stop reliance on burning coal by 2035
  • 100,000 new jobs by 2040, most in regional Queensland
  • 11.5GW of rooftop solar and 6GW of embedded batteries
  • 95% of investment in regional Queensland
  • Building Queensland’s first hydrogen ready gas turbine

With this announcement by the Premier, Edge look forward to more renewable generation entering the market resulting in savings for end users and the planet.

If procuring renewable energy is one of your company goals, Edge2020 can help you build a PPA to support your sustainability strategies. Contact us on 1800 334 336 or info@edge2020.com.au