
Solar generation and its impact on spot price is a topic of major discussion, particularly in the ‘Sunshine State’ of Queensland where there is a continuous pipeline of solar generation development. This raises the question: is strong solar generation having an impact on spot prices, and if so, is it lowering or increasing prices?
Increasing Large-scale Solar Penetration in the NEM
It is no secret that solar generation has increased dramatically over the last 12-18 months. From 1 January 2018 to 30 June 2018 (inclusive) the average daily production of large-scale solar generation in Queensland was only approximately 14.2 MW, only accounting for 0.085% of total Queensland generation.
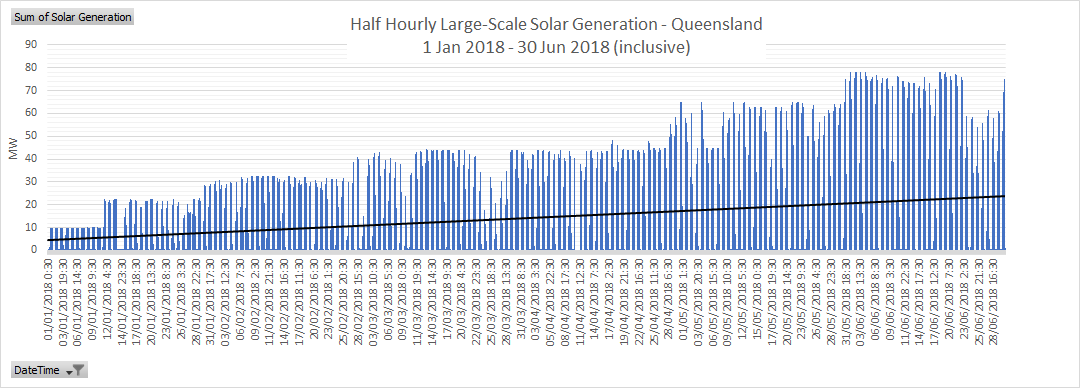
(Source: AEMO)
For the six months between 1 July 2018 to 31 December 2018 (inclusive), the average daily production of large-scale solar generation in Queensland increased to 125.3 MW and accounted for 1.9% (an increase of > 1% on the previous 6 months) of total Queensland generation during that period.
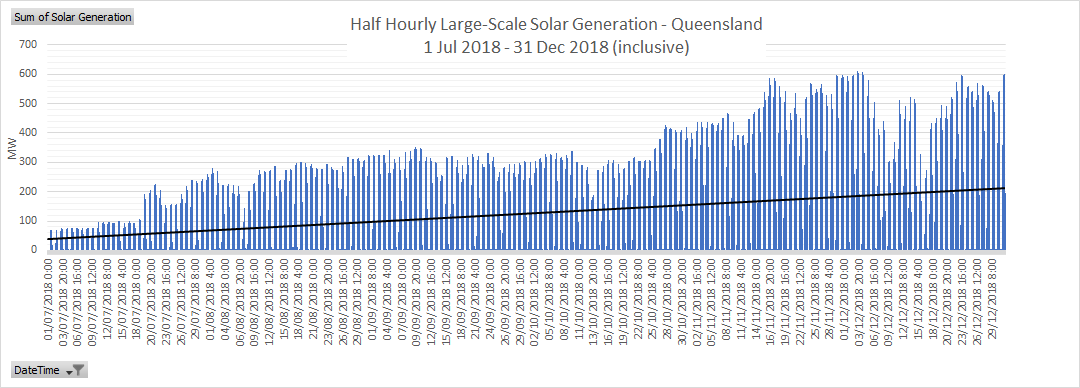
(Source: AEMO)
Fast forward to 2019, and generation volumes from large-scale solar generators has continued to increase, reaching a maximum of 917 MW on 08/05/2019 at 11:30. From 1 January 2019 to 30 June 2019 (inclusive) the average daily production of large-scale solar generation in Queensland increased to 205.6 MW and accounted for 3% (an increase of an additional 1% on the previous 6 months) of total Queensland generation.
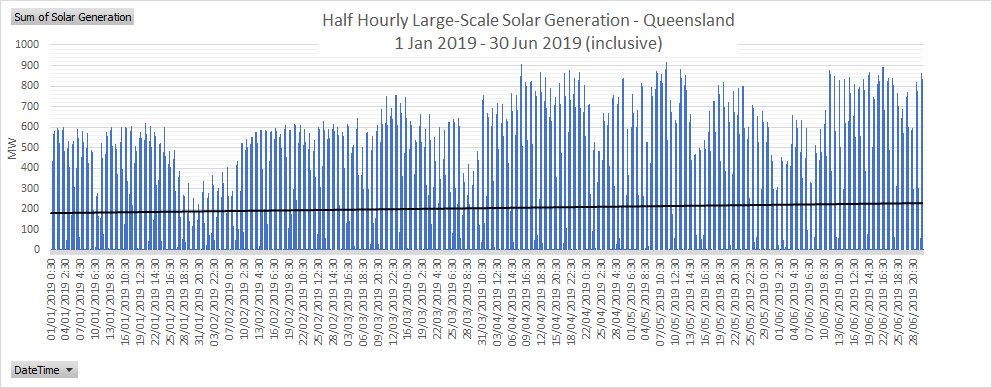
(Source: AEMO)
The Rooftop (Photovoltaic) Reckoning
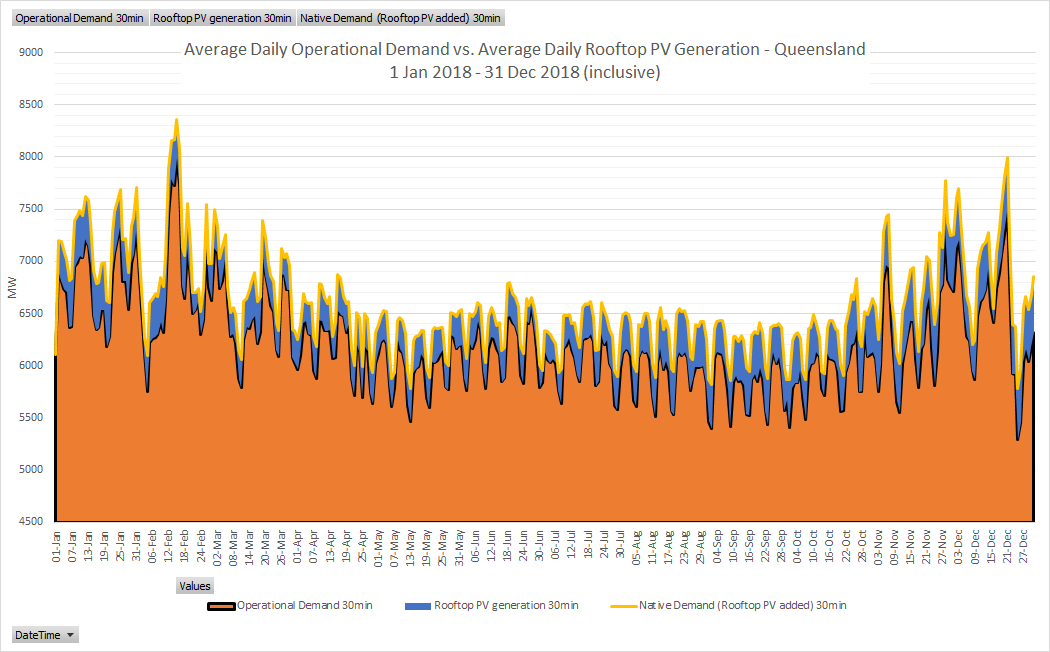
So far, we have only evaluated large-scale generation and its penetration in Queensland, however there is another solar photovoltaic beast infiltrating the NEM, namely Rooftop PV (small-scale home and business installations). If we look at similar timelines, home and business owners are deciding to take more control of where their energy comes from, with multiple household and business rooftops opting to install solar panels on what would be wasted space (and opportunity). It is important to understand, rooftop PV falls within AEMO’s (Australian Energy Market Operator) category of distributed energy resources which is subtracted from native demand to determine operational demand.
The general trend for rooftop PV is that its contribution to the energy mix is growing constantly. The maximum volume between 1 January 2018 to 30 June 2018 (inclusive) reached 1.4 GW, with the period 1 July 2018 to 31 December 2018 (inclusive) recording a maximum of 1.78 GW. That is an increase of almost 400 MW in six months. On average, rooftop PV reduced native Queensland demand by 345 MW each day on 30-minute demand figures across the entire 2018 Calendar Year.
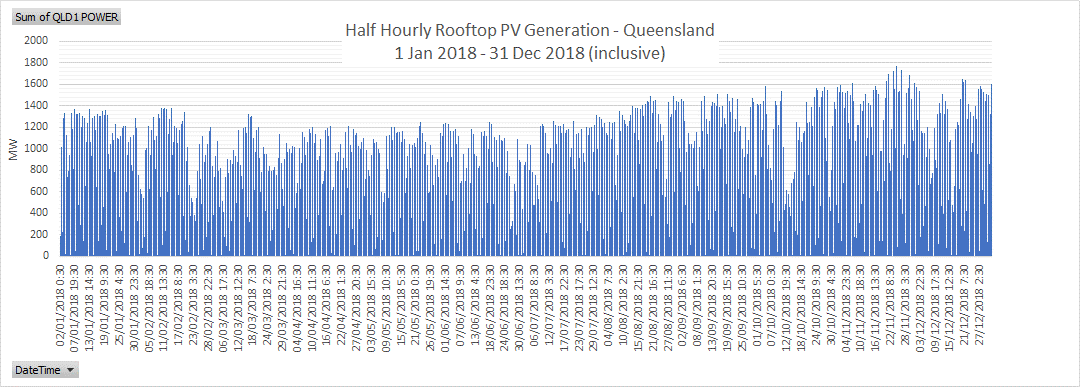
(Source: AEMO)
(Source: AEMO)
Roughly year-to-date, we have not seen the same strong performance from rooftop PV. However, summer 2020 could provide a new rooftop PV maximum for Queensland and NEM wide with the Australian Photovoltaic Institute recording on average for the period of 1 January 2019 to 31 March 2019 (inclusive), an additional 16,200 reported installations.
(Australian PV Institute Solar Map, funded by the Australian Renewable Energy Agency, accessed from pv-map.apvi.org.au on 4 July 2019)
Impact to Spot Price
As the graph below depicts the calendar year, daily average half hourly pricing from 2013 to YTD 2019 (excluding 2017 as an outlier with bidding direction from Queensland government to GOCs). Despite the growth and increase in both average (half-hourly) rooftop PV and large-scale solar generation, spot prices have also increased. This is not to say that solar is to blame for the increase in prices, as price has not increased in all hours of the day.
To summarise the changes:
- The morning peak has remained roughly the same across the years with a sharper ramp-up depicted in earlier years.
- Evening peak has shifted further into the evening than earlier years depicted and is not as strong.
- The off-peak hours have become increasingly more valuable in comparison to earlier years.
- However, the biggest and possibly strangest movement is the daylight hour prices, or solar hours have roughly remained the same (apart from 2014/15).
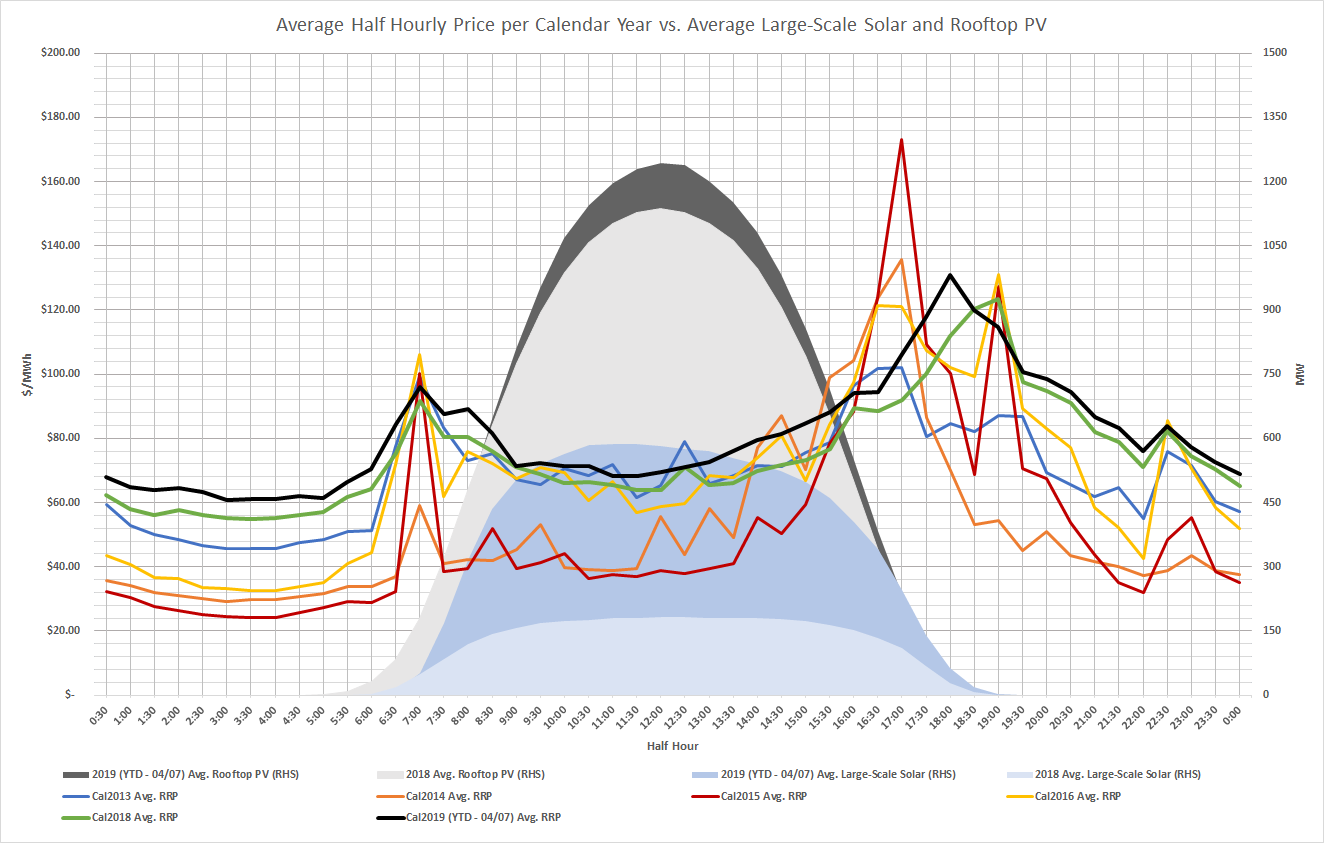
(Source: AEMO)
We cannot conclusively say that the increase in solar generation is the sole reason for prices heading on an upward trajectory since 2014 (as the table below depicts), however it would be fair to say the increase in solar has played a part in it. The addition of the strong solar penetration has changed the dynamic of the market, causing thermal generators and other fuel types to re-think how they will recover the costs of their 15, 20, 30-year investments. Thermal generators will likely start by displacing the price curve and increasing bids in the off-peak periods. The evidence is clear in that the off-peak periods are now increasingly more valuable than they were 3-6 years ago.
On top of this, a large portion of solar generation is being built north of the Calvale and Wurdong substations in Queensland and is having little effect (unless new infrastructure is built) on middle of the day spot prices. This is due to contingent and operational constraints placed on the power lines by AEMO so as to not overload the lines, forcing generation north of this constraint (solar inclusive) to constrain off. Nonetheless, there are a multitude of factors impacting the price in Queensland and solar generation’s impact on prices should not be overlooked. However, one thing is for certain, spot prices have been increasing since 2014 (see below table) and in the near term show little sign of slowing.
| Calendar Year ($/MWh) | ||||||
| QLD | 2013 | 2014 | 2015 | 2016 | 2018 | 2019 YTD |
| Avg Spot Price | $ 68.41 | $ 50.91 | $ 51.96 | $ 67.32 | $ 74.82 | $ 80.64 |
(Source: AEMO)
If you would like further information on the impact of solar generation, please contact your Manager Wholesale Clients or Edge on (07) 3905 9220.
