What’s Oil got to do with it?

There is no doubt that energy markets and the energy industry itself are rapidly evolving and moving away from fossil fuels. The evolution of energy seems to be coming, and only coming faster given this tumultuous time the people and countries across the world have endured. Lets start with oil; Australian’s across the nation are very aware of the recent global oil price crash to new historic levels, particularly when it is reported in the news headlines that Australian’s are seeing almost 15-year lows at the petrol bowser. The impact of the recent oil price crash however does not stop at the bowser, it has and will continue to have significant impacts on energy markets across the globe including in Australia.

Oil prices have been hit recently due to two major events; one being the global epidemic of COVID-19, resulting in a significant reduction in demand for oil across the globe. The International Energy Agency’s (IEA) April 2020 reports an expected drop in demand of global oil of 9.3 million barrels(mb)/day year on year for 2020, with April 2020 demand estimated to be lower than 2019’s demand by 29 mb/day. The second impact to oil markets has been the oil price and supply war between OPEC’s pseudo leader Saudia Arabia and non-OPEC nation, Russia, two of the largest global oil exporters. Saudi Arabia and Russia could not agree levels of supply, leading to Saudia Arabia flooding the market with oil and prices, both spot and futures, reaching new lows. The quarrel between the two global oil market power-houses and the impacts of the COVID-19 on demand for oil has led to the historical event where the West Texas Intermediate (WTI) oil price index fell into negative price territory, with May 2020 future prices settling at -USD$37.63/barrel on the 20/04/2020, after reaching a low of -USD$40.32/barrel earlier that day.

The major oil index, WTI, saw futures prices for June 2020 contracts settling at around USD$17/barrel on the 29/04/2020, whilst Brent Crude, another major oil index also felt the pain of slowing demand, with prices dropping below USD$20/barrel on the 27/04/2020. But the impact of tumbling oil prices reaches far and wide, particularly here in Australia. Australia has a booming natural gas industry and was the largest exporter of liquified natural gas (LNG) as of January 2020. A significant number of gas sales agreements are linked to the crude oil indices, with Australian gas companies feeling the hurt given the tumble in oil prices. Brent Crude oil futures for June 2020 contracts settled at around USD$24/barrel on the 29/04/2020. At these prices, the likes of Santos and Oil Search will be hurting given both flagged a cashflow breakeven oil price of ~USD$25-29/barrel, and USD$32-33/barrel, respectively. Demand for natural gas in international markets has also tumbled, and due to the linkage between oil prices and gas contracts, spot contract prices have shifted down, with June 2020 contracts settling at AUD$2.87/GJ (~USD$1.88/GJ) as of the 30/04/2020, again a far reach from prices seen in November 2019 of ~AUD$7.30/GJ (~USD$5/GJ).

Further impacts of the oil market crash on gas markets has been cheaper domestic gas prices for consumers. Queensland, the largest gas extractor and exporter on the east coast has seen prices in its short-term trading market (STTM) in Brisbane reach as low as AUD$2.31/GJ in March 2020, a significant drop from AUD$9-11/GJ we witnessed the same in 2019. Other energy commodities have also seen a decline off the back of the oil price tumble, including thermal coal. As stated above, with gas prices domestically and internationally falling away, thermal coal prices have come off due to energy users opting for cheaper fuel sources such as oil and gas. Spot thermal coal contracts for the May 2020 settled at USD$52.35/metric ton(mt) on 30/04/2020, far softer than spot prices a year ago at ~USD$90/mt.

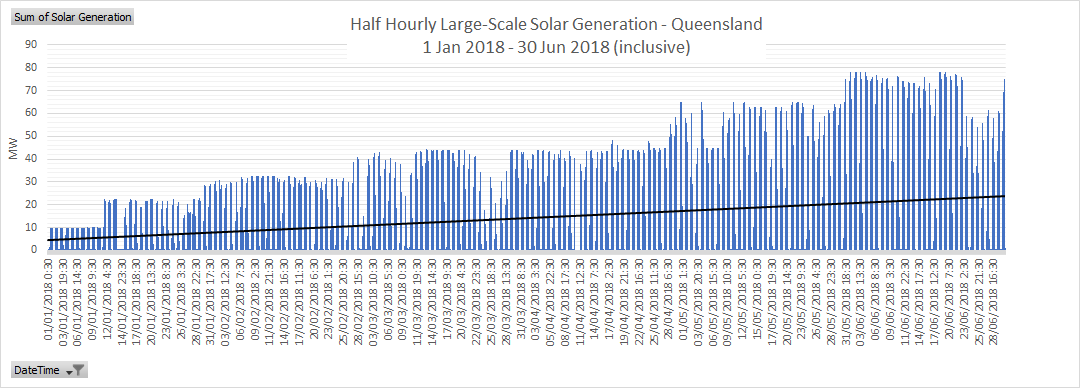
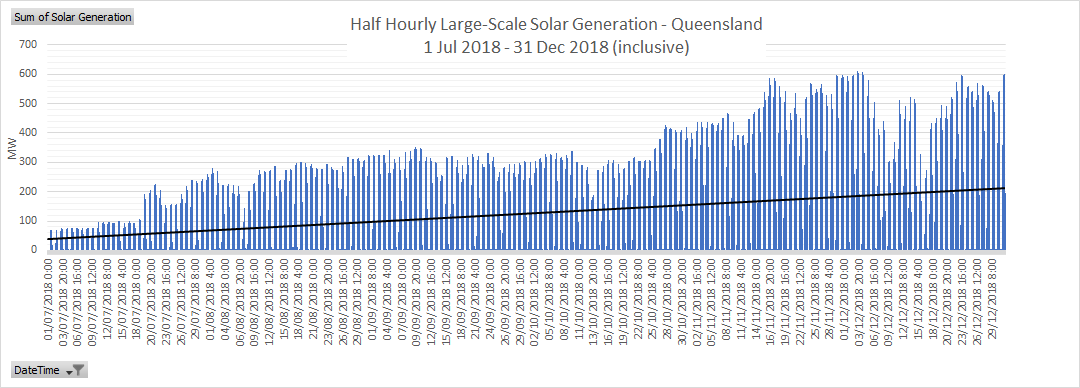
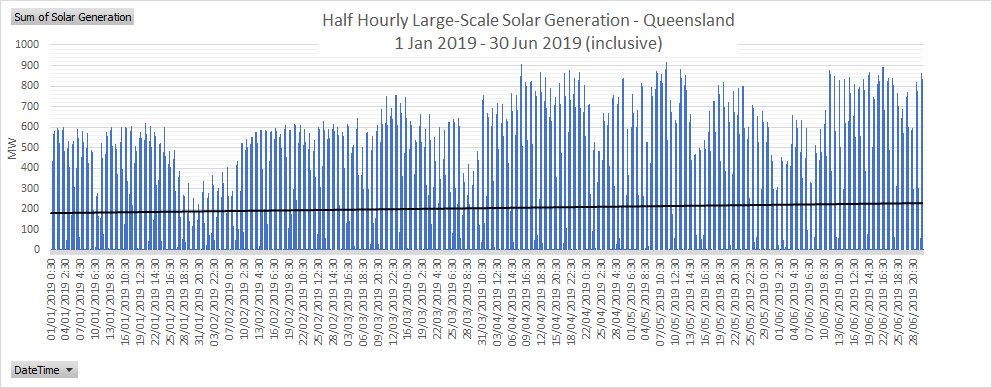
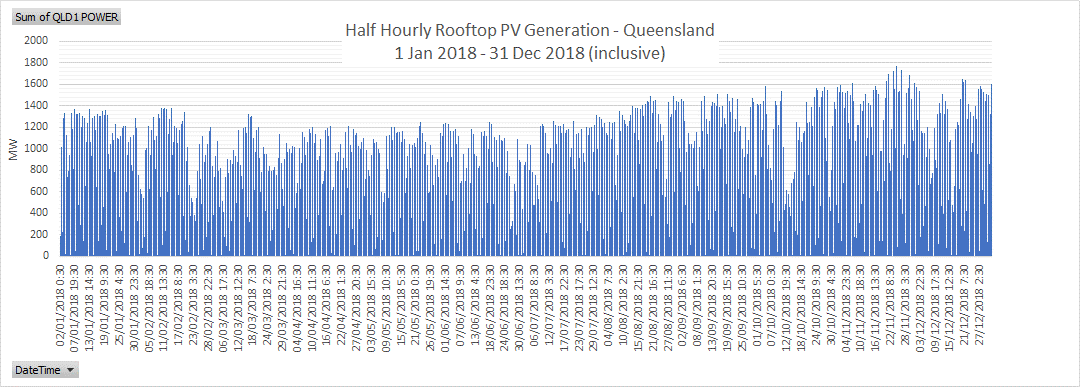
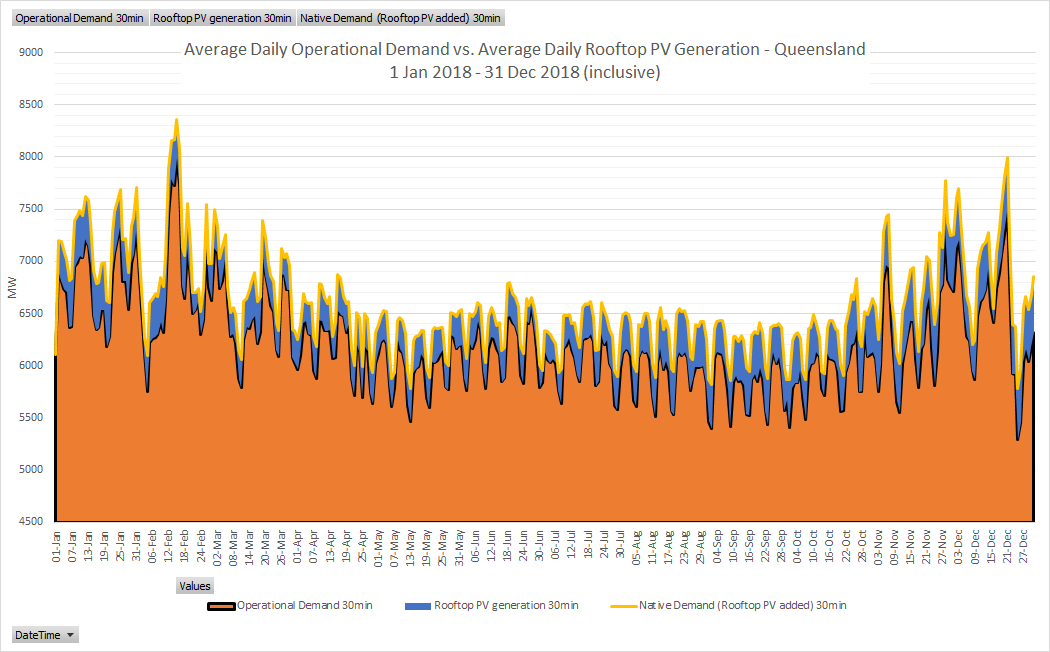
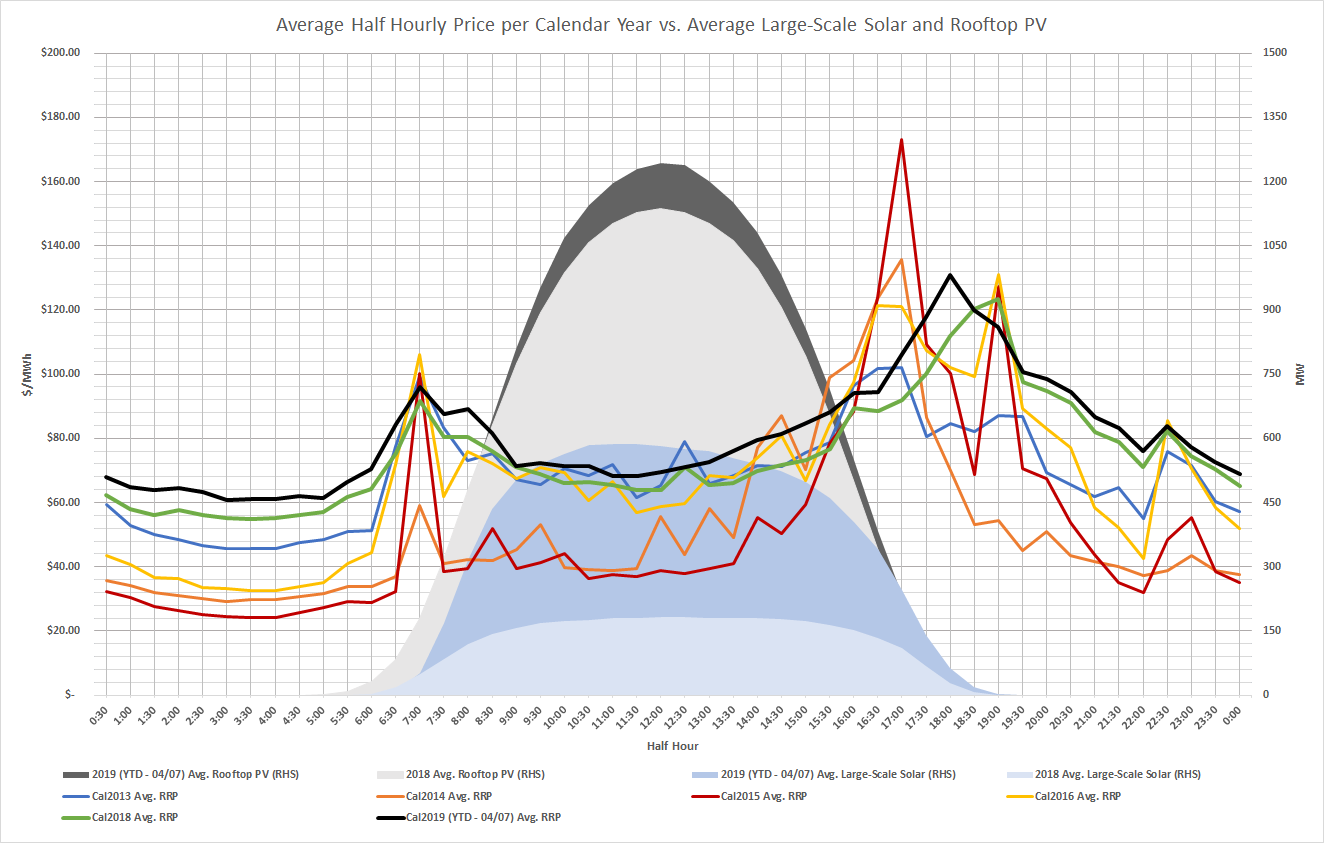
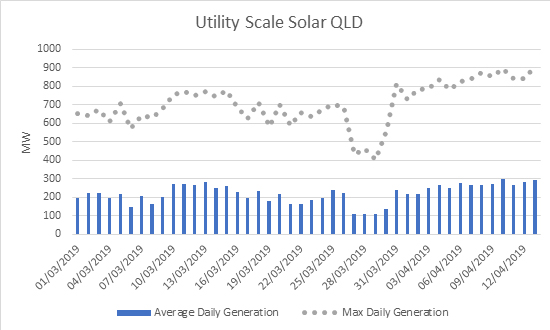
This brings us to the all-important energy market and commodity, electricity, which with all the above combined has seen electricity prices fall off a cliff. The National Electricity Market (NEM) in the last few years has been on a renewable power growth spurt. Queensland for instance has the highest penetration of large scale solar generation of approximately ~2,400 MW and a significant penetration of rooftop solar reaching ~2,100 MW, combine them together and on a mild April day in 2020, you have almost 2 thirds of maximum demand. With renewable energy displacing thermal/fossil fuels, off the back of reducing pricing for the technology and subsidies in the form of renewable energy certificates (RECs), combined with both far cheaper gas prices allowing gas plant to bid in and capture price spikes due to their fast-start and intermittent operating capabilities, and reduced demand for electricity due to the impact of COVID-19 with business and industry operating skeletally, electricity prices continue to sit at prices not witnessed since 2016.

All the above has been caused by two events, both significant to the global economy, and the energy industry in their own rights. One thing is for sure, the events have helped push the electricity market on the East Coast of Australia into a new direction far quicker than it may have if the two COVID-19 and the oil price crash did not occur. We are seeing new market design concepts (ie. capacity markets, two-sided markets) and new contract market products (ie. super-peak swap) coming to light, that give way to new technologies and greater competition. The abundance of natural gas in Australia is affordable for households for heating and is finally being utilised as the ‘transition’ or bridging fuel it was always pegged as, to renewable energy in the wholesale market. One thing is for certain, change is afoot, and it definitely has me excited.

If you have any questions regarding this article or the electricity market in general, call Edge on 07 3905 9220 or 1800 334 336.

Semi-scheduled and Intermittent Non-scheduled Generators urged to advise of De-ratings

A new market notice within the National Electricity Market (NEM) posted by the Australian Energy Market Operator (AEMO), one we have not see before was issued to all market participants on the 23/12/19. The market notice requested and served as a reminder for all semi-scheduled and intermittent non-scheduled generators to ensure they update their market availability bids, update their SCADA Local Limit or, if unavailable, advise AEMO control room to implement a quick constraint to the reduced available capacity level; and update intermittent generation availability in the EMMS Portal to reflect reduced plant availability as is required under the National Electricity Rules (NER), per NER 3.7B(b).limits.

This was an interesting constraint for AEMO to issue as it was due to extreme heatwave conditions across the south east coast of Australia, and as with most generating plant, under extreme heat, some form of derating on its physical capacity and output can occur. On the 23/12/19 AEMO’s weather service provider was forecasting extreme high ambient temperatures across all NEM regions, hence AEMO’s market notice to these participants to remind semi-scheduled and intermittent non-scheduled generators to advise AEMO of any reduction in available capacity caused by temperature derating.

Particularly interesting is that the often “set and forget” approach to renewable generators such as solar and wind generators, as classified by AEMO as semi-scheduled generation is being watched with greater scrutiny, particularly after the events of 2016 in SA where a state wide blackout was triggered by a severe weather, damaging more than 20 towers, downing major transmission lines, and with multiple wind farms currently shouldering some of the blame for the state going black due to the wind farms switching off when the transmission lines went down.

Semi-scheduled: A generating system with intermittent output (like a wind or solar farm), and an aggregate nameplate capacity of 30 MW or more is normally classified as a semi-scheduled generator unless AEMO approves its classification as a scheduled generating unit or a non-scheduled generating unit. AEMO can limit a semi-scheduled generator’s output in response to network constraints, but at other times the generator can supply up to its maximum registered capacity (AEMO 2014).

If you have any questions regarding this article or the electricity market in general, call Edge on 07 3905 9220 or 1800 334 336.

High solar generation vs spot prices in Queensland

Alex Driscoll, Manager Wholesale Clients and Markets

Solar generation and its impact on spot price is a topic of major discussion, particularly in the ‘Sunshine State’ of Queensland where there is a continuous pipeline of solar generation development. This raises the question: is strong solar generation having an impact on spot prices, and if so, is it lowering or increasing prices?

Increasing Large-scale Solar Penetration in the NEM

It is no secret that solar generation has increased dramatically over the last 12-18 months. From 1 January 2018 to 30 June 2018 (inclusive) the average daily production of large-scale solar generation in Queensland was only approximately 14.2 MW, only accounting for 0.085% of total Queensland generation.

(Source: AEMO)

For the six months between 1 July 2018 to 31 December 2018 (inclusive), the average daily production of large-scale solar generation in Queensland increased to 125.3 MW and accounted for 1.9% (an increase of > 1% on the previous 6 months) of total Queensland generation during that period.

(Source: AEMO)

Fast forward to 2019, and generation volumes from large-scale solar generators has continued to increase, reaching a maximum of 917 MW on 08/05/2019 at 11:30. From 1 January 2019 to 30 June 2019 (inclusive) the average daily production of large-scale solar generation in Queensland increased to 205.6 MW and accounted for 3% (an increase of an additional 1% on the previous 6 months) of total Queensland generation.

(Source: AEMO)

The Rooftop (Photovoltaic) Reckoning

So far, we have only evaluated large-scale generation and its penetration in Queensland, however there is another solar photovoltaic beast infiltrating the NEM, namely Rooftop PV (small-scale home and business installations). If we look at similar timelines, home and business owners are deciding to take more control of where their energy comes from, with multiple household and business rooftops opting to install solar panels on what would be wasted space (and opportunity). It is important to understand, rooftop PV falls within AEMO’s (Australian Energy Market Operator) category of distributed energy resources which is subtracted from native demand to determine operational demand.

The general trend for rooftop PV is that its contribution to the energy mix is growing constantly. The maximum volume between 1 January 2018 to 30 June 2018 (inclusive) reached 1.4 GW, with the period 1 July 2018 to 31 December 2018 (inclusive) recording a maximum of 1.78 GW. That is an increase of almost 400 MW in six months. On average, rooftop PV reduced native Queensland demand by 345 MW each day on 30-minute demand figures across the entire 2018 Calendar Year.

(Source: AEMO)

(Source: AEMO)

Roughly year-to-date, we have not seen the same strong performance from rooftop PV. However, summer 2020 could provide a new rooftop PV maximum for Queensland and NEM wide with the Australian Photovoltaic Institute recording on average for the period of 1 January 2019 to 31 March 2019 (inclusive), an additional 16,200 reported installations.

(Australian PV Institute Solar Map, funded by the Australian Renewable Energy Agency, accessed from pv-map.apvi.org.au on 4 July 2019)

Impact to Spot Price

As the graph below depicts the calendar year, daily average half hourly pricing from 2013 to YTD 2019 (excluding 2017 as an outlier with bidding direction from Queensland government to GOCs). Despite the growth and increase in both average (half-hourly) rooftop PV and large-scale solar generation, spot prices have also increased. This is not to say that solar is to blame for the increase in prices, as price has not increased in all hours of the day.

To summarise the changes:

  • The morning peak has remained roughly the same across the years with a sharper ramp-up depicted in earlier years.
  • Evening peak has shifted further into the evening than earlier years depicted and is not as strong.
  • The off-peak hours have become increasingly more valuable in comparison to earlier years.
  • However, the biggest and possibly strangest movement is the daylight hour prices, or solar hours have roughly remained the same (apart from 2014/15).

(Source: AEMO)

We cannot conclusively say that the increase in solar generation is the sole reason for prices heading on an upward trajectory since 2014 (as the table below depicts), however it would be fair to say the increase in solar has played a part in it. The addition of the strong solar penetration has changed the dynamic of the market, causing thermal generators and other fuel types to re-think how they will recover the costs of their 15, 20, 30-year investments. Thermal generators will likely start by displacing the price curve and increasing bids in the off-peak periods. The evidence is clear in that the off-peak periods are now increasingly more valuable than they were 3-6 years ago.

On top of this, a large portion of solar generation is being built north of the Calvale and Wurdong substations in Queensland and is having little effect (unless new infrastructure is built) on middle of the day spot prices. This is due to contingent and operational constraints placed on the power lines by AEMO so as to not overload the lines, forcing generation north of this constraint (solar inclusive) to constrain off. Nonetheless, there are a multitude of factors impacting the price in Queensland and solar generation’s impact on prices should not be overlooked. However, one thing is for certain, spot prices have been increasing since 2014 (see below table) and in the near term show little sign of slowing.

Calendar Year ($/MWh)
QLD 2013 2014 2015 2016 2018 2019 YTD
Avg Spot Price  $    68.41  $    50.91  $    51.96  $    67.32  $    74.82  $    80.64

(Source: AEMO)

If you would like further information on the impact of solar generation, please contact your Manager Wholesale Clients or Edge on (07) 3905 9220.

LNP Inertia Continues

In a surprise outcome the LNP maintained leadership over the weekend noting that it remains unknown whether or not the LNP will form a majority government. Energy and climate were at the heart of this election with Labor putting forward material initiatives that would increase investment in renewable energy generation (increased funding to the CEFC) and reduce emissions through the extension of the safeguard mechanism, amongst a number of other initiatives. The LNP are less ambitious and maintain the emissions reduction target of 26-28% below 2005 levels by 2030. The LNP will extend the Climate Solutions Fund by providing additional funding to the Emissions Reduction Fund which is the reverse auction of ACCU’s managed by the Clean Energy Regulator.

In terms of energy generation and transmission the LNP has pledged support for Snowy Hydro 2.0, the Underwriting New Generation Investment program and Marinus Link (Interconnector between TAS and VIC, part of the Battery of the Nation plan).

The futures markets (energy and environmental certificates) had priced in a Labor victory. The result over the weekend may put upward pressure on forward prices (energy & Enviro) as there will be less new renewable generation invested in over the coming years. That being said, state based renewable energy targets remain in place as per the following:

QLD – 50% Renewable by 2030

NSW – No target

VIC – 25% by 2020 and 40% by 2025

SA – No target

Tas – 100% by 2022

The larger demand states are QLD, NSW and VIC who are still heavily reliant on coal powered generation. NSW is the only state of these three whereby there is no target. Given that QLD and VICs renewable energy targets remain in place there should not be a material decline in new renewable generation development in these regions. For NSW, at least for the time being, new renewable generation will be a function of price. Currently NSW prices are at a level whereby a solar or wind developer should be able to secure funding and a PPA.

If you would like to know more about the potential impact that our LNP government may have on Australian energy prices, please contact Edge Energy Services on 07 3905 9220 or 1800 334 336.

Queensland spot prices – March vs April to date

In Queensland, we have observed lower daytime spot prices since the beginning of April, relative to March averages.

Taking a closer look at half hourly average spot prices seen so far in April, we can see that between 8am and 4pm spot prices have been softer than the same periods in March. Following this, spot prices are higher in the evening peak periods. Whilst it is a very small data set, this is the relationship that many in the market expect to evolve.

Softer spot prices in the day will motivate generators to price more aggressively (price higher) in the evening peak to increase earnings which have been lost during the day.

Should we see this evolution of softer spot prices during the sunlight hours of the day, it will put further strain on the Queensland solar industry which has had several setbacks of late.

In addition, we can observe from the below graph that there has been an increase in generation from utility scale solar, in terms of both peak and average generation. The increase in solar is making more low-cost generation available in Queensland. New generation from these solar plants remains insufficient to meet all demand and therefore, solar is not setting prices.

If you have any questions regarding spot prices or any other matter relating to energy, please contact Edge Energy Services on 07 3905 9220 or 1800 334 336.

Clean Energy Regulator confirms 2019 RRP and STP

On 12 March 2019, the Clean Energy Regulator (CER) has confirmed the 2019 renewable power percentage (RPP) and small-scale technology percentage (STP) has been set by legislative amendment.

The 2019 RRP has been set at 18.6% and the 2019 STP has been set at 21.73%.

As explained by the CER, the RRP and STP set the annual statutory demand for large-scale generation certificates and small-scale technology certificates in the Renewable Energy Target.

If you have any questions regarding the 2019 RRP or STP or any other matter relating to energy, please contact Edge Energy Services on 07 3905 9220 or 1800 334 336.

AEMO releases draft Marginal Loss Factors

The Australian Energy Market Operator (AEMO) released its draft marginal loss factors (MLFs) today. As generally expected, solar and wind farms that are a long distance from the regional reference point have been hurt.

The most notable example of this is the Broken Hill solar farm, which has a draft MLF for FY20 of 0.7254. This is 0.2535 below the current MLF. If the draft MLF is confirmed in the final report (due 1 April 2019), this will reduce the volume of electricity sold by the solar farm by 25%.

A number of other solar and wind farms had material reductions in MLF and are facing a challenging situation. Most notably, Silverton Wind Farm (NSW), Karadoc Solar Farm (VIC), Griffith Solar Farm (NSW) and Parkes Solar Farm (NSW).

MLFs are very difficult to estimate, which is reflected in the relatively large change we are observing year on year. Amongst many other concerns, this creates uncertainty for the investment community.

If you have any questions regarding the draft MLFs or any other matter relating to energy, please contact Edge Energy Services on 07 3905 9220 or 1800 334 336.

CleanCo Moving Ahead – Part 2

With expectations that CleanCo will be trading in the NEM by mid this year, things are getting into full swing. Last week CleanCo appointed its first two key executives – Miles George and Geoff Dutaillis.

Who are these new executives?

Miles George has been appointed the Interim Chief Executive Officer (CEO) at CleanCo. His role at CleanCo is to secure cleaner, more affordable, sustainable energy and secure supply of electricity for Queensland (QLD). He was previously the CEO and Managing Director of Infigen Energy. After leaving Infigen Energy in 2016, Miles continued as a strategic adviser until December 2017. During and after his time at Infigen, Miles has been the Chairman of the Clean Energy Council, a representative on the AEMC Reliability panel, an Expert panel member for AEMO and Director of the Australian Conservation Foundation.

Geoff Dutaillis has been appointed the General Manager of Transition. Geoff was most recently the CEO (Australia) of Wind Energy Holdings, a leading renewable energy company based in Thailand. The company has interest in various Australian wind farms. Geoff has also held executive positions at Infigen Energy as Chief Operating Officer (COO) from 2009 until 2013 and Lendlease more recently as Head of Sustainability.

 What is the mandate for CleanCo?

CleanCo has the mandate to increase competition in the electricity market at peak times of demand when prices are generally at their highest. CleanCo is expected to transform intermittent renewable generation into firm financial products for customers and retailers while backing QLD’s renewable energy and low emissions generators.

 Which of the existing generators are to be transferred from the current government owned corporations; Stanwell and CS Energy?

Initially, CleanCo’s portfolio will include a range of existing renewable and low emission energy generation assets including:

  1. Wivenhoe pump storage hydro plant,
  2. Swanbank E gas-fired power station, and
  3. Barron Gorge, Kareeya and Koombooloomba hydro power stations.

If you have any questions regarding CleanCo or any other matter relating to energy, please contact Edge Energy Services on 07 3905 9220 or 1800 334 336.

High temperatures forecast for southern states

At the end of the last week, AEMO flagged the possibility of extreme temperatures for the following week in South Australia, Victoria and New South Wales.

Weather forecasts were showing a large uncertainty in the predicted temperatures. Predictions ranged from mid to high 30s for Victoria, low to mid 40s for South Australia and high 30s for New South Wales. The key risk in these forecasts was the possibility of temperatures exceeding 40 degrees in two or more regions simultaneously.

On 11 January, AEMO published a market notice highlighting the forecast extreme temperatures in South Australia and elevated temperatures in Victoria and New South Wales. In this notice, AEMO provided forecast temperatures and generation capacity reference temperatures for generators to consider when updating their generation levels. Temperature and humidity have significant impacts on the performance of coal and gas powered generation.

On the back of this, AEMO updated its demand forecast and the resulting higher demand caused a lack of reserve to be triggered. The lack of reserve was forecast between 15:00 and 18:00 on 15 January. AEMO requested a market response from generators to make generation available to fulfil the shortfall.

Between 11 January and 15 January AEMO published further market notices updating the expected lack of reserve for 15 January and requested further generation response.

Pre-dispatch prices and demand for 15 January were published by AEMO the day prior. Spot prices were forecast to reach $14,500/MWh based on a demand of 8,800MW, which is significantly higher than normal levels.

As the afternoon approached, temperatures were high but a cool change was also approaching.

At 11:57 on 15 January, AEMO issued a market notice cancelling the lack of reserve.

As a result of the increased availability of generators and the cool change, AEMO revised their demand forecast down 800MWs. The resultant shift in supply and demand drove forecast prices down from $14,500 /MWh to $300/MWh.

Contract market prices are influenced by the outcomes of the spot market. As a result of the forecast high prices in South Australia,Victoria and New South Wales, the contract market prices increased in the build-up to 15 January; however, as the forecast spot prices and actual spot prices reduced, the contract market also reduced.

Retailers and large industrials are provided cover from the volatility of the spot market by purchasing contracts at a fixed price. However, the impact of the spot market can influence when volume is purchased to achieve the desired outcome for a business.

If you have any questions regarding this article or the electricity market in general, call Edge on 07 3905 9220 or 1800 334 336.

A lesson from RCR Tomlinson: corporate PPA’s and the sharing of risk

RCR Tomlinson entering voluntary administration this week has been a major eye-opener in the renewable energy world. The engineering firm had shown signs of stress earlier in the year, particularly when it was forced to record a $57 million write-down on the value of it’s Daydream and Hayman solar farms in Queensland. Following this, the company successfully went to market and raised an additional $100 million in capital. Now after incurring liquidated damages as a result of running late on solar projects, directors had no choice but to put the company into administration.

In the renewable energy space, these events particularly emphasise the potential risk of entering into a PPA with a project that requires development prior to receiving any MWh. For those considering entering into a renewable PPA, it is imperative to be mindful of the gravity of the project risk taken with these developments. With increasingly stringent connection criteria being enforced by AEMO and transmission companies, corporate PPA off-takers need to consider the structuring of risk in the PPA to avoid being exposed in situations like this.

There are several ways to manage project risk through legal and commercial arrangements. Without being privy to the details of RCR Tomlinson’s contracts, it would appear that the company was wearing “connection to the grid” risk. On face value, this would have felt like a win to the off-taker. However, the off-takers are now in a position where the risk has fallen onto them due the collapse of the company. Whilst RCR Tomlinson shouldn’t have taken that risk, the PPA counterparties arguably also should not have turned a blind eye to the potential project risk.

This is an important lesson for any corporate entity looking to enter into a PPA, by understanding whether your developer and construction partners have the appropriate means to manage the risk that is placed on them. Having liquidated damages in a contract is essential. However, be mindful that at the end of the day, if a company is placed into administration and subsequently liquidated, liquidated damages are worthless.