Queensland Government direction to Stanwell lifted

The CEO of Stanwell was quoted yesterday in Reneweconomy.com.au stating that “bidding direction ended on 30 June 2019” in reference to the direction given to Stanwell form the Queensland Government in May 2017 to lower wholesale prices.

Spot prices have been soft since 1 July 2019 across the NEM and there is currently no evidence to suggest that Stanwell (and CS Energy) have immediately reacted to the lift of the direction.

When the direction was first given by the Queensland Government in 2017 to Stanwell, energy prices materially came down and generally speaking have been less volatile. Key assets such as Swanbank E and Wivenhoe have been utilised by Stanwell and CS Energy to stop prices spikes above $300.00/MWh.

There is now the potential for Stanwell and CS Energy to utilise their large generation portfolios to potentially increase earnings through higher energy prices. 

If you would like to know more about the potential impact that the lifting of the direction may have on Australian energy prices, please contact Edge Energy Services on 07 3905 9220 or 1800 334 336.

Updates to EdgeLIVE

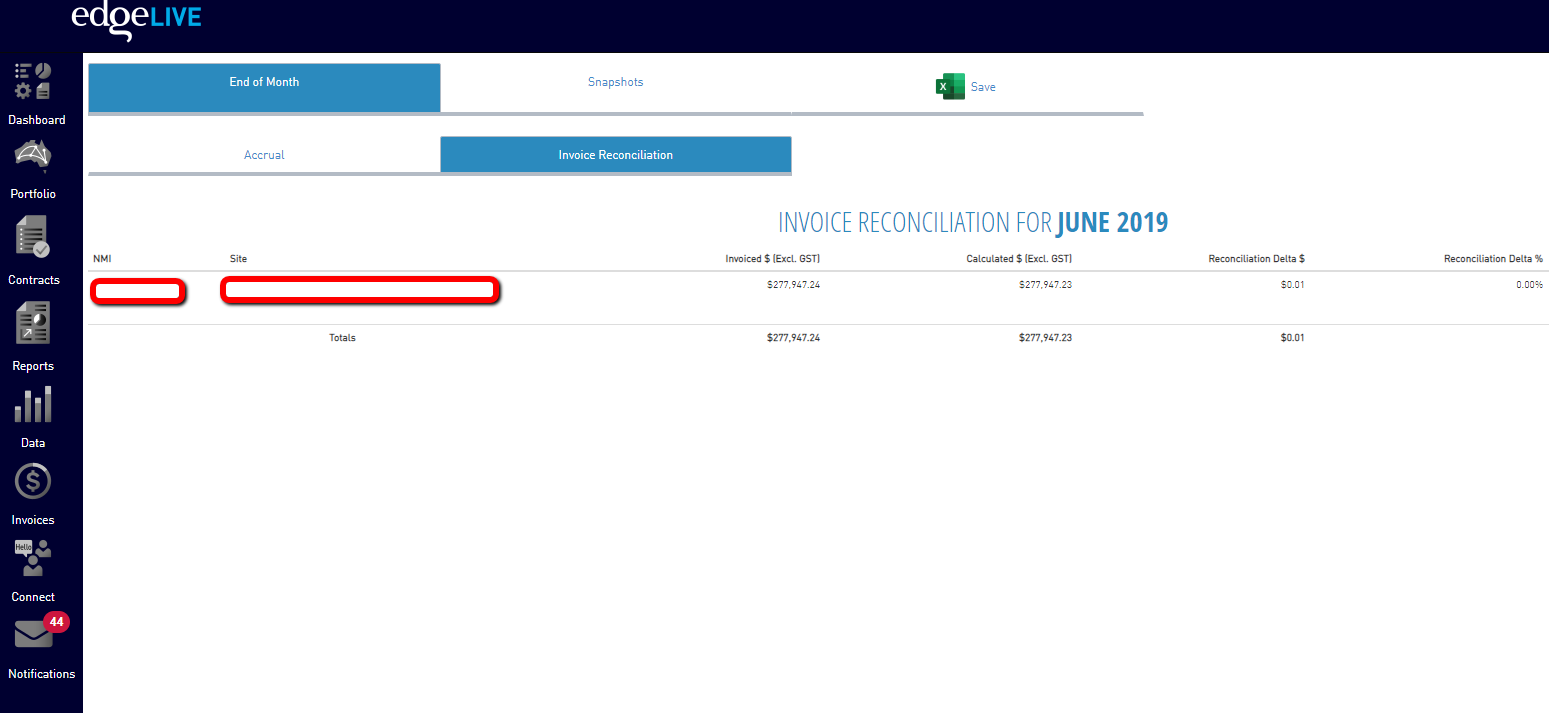
With our vision to create a superior energy management platform, we are constantly developing EdgeLIVE to improve its look and overall functionality for our customers. Our technology team have been working tirelessly to completely overhaul the EdgeLIVE Dashboards and navigation functions relating to your ‘end of month’ account management reporting.

Dashboards

EdgeLIVE now has dedicated dashboards for Accruals and Invoice Reconciliation. The new dashboards display a summary of the invoice for each NMI, as well as a line-by-line breakdown of the individual invoice items. The new functionality is easy to follow and can provide users with as little or as much detail as is required.

Snapshot Dashboard

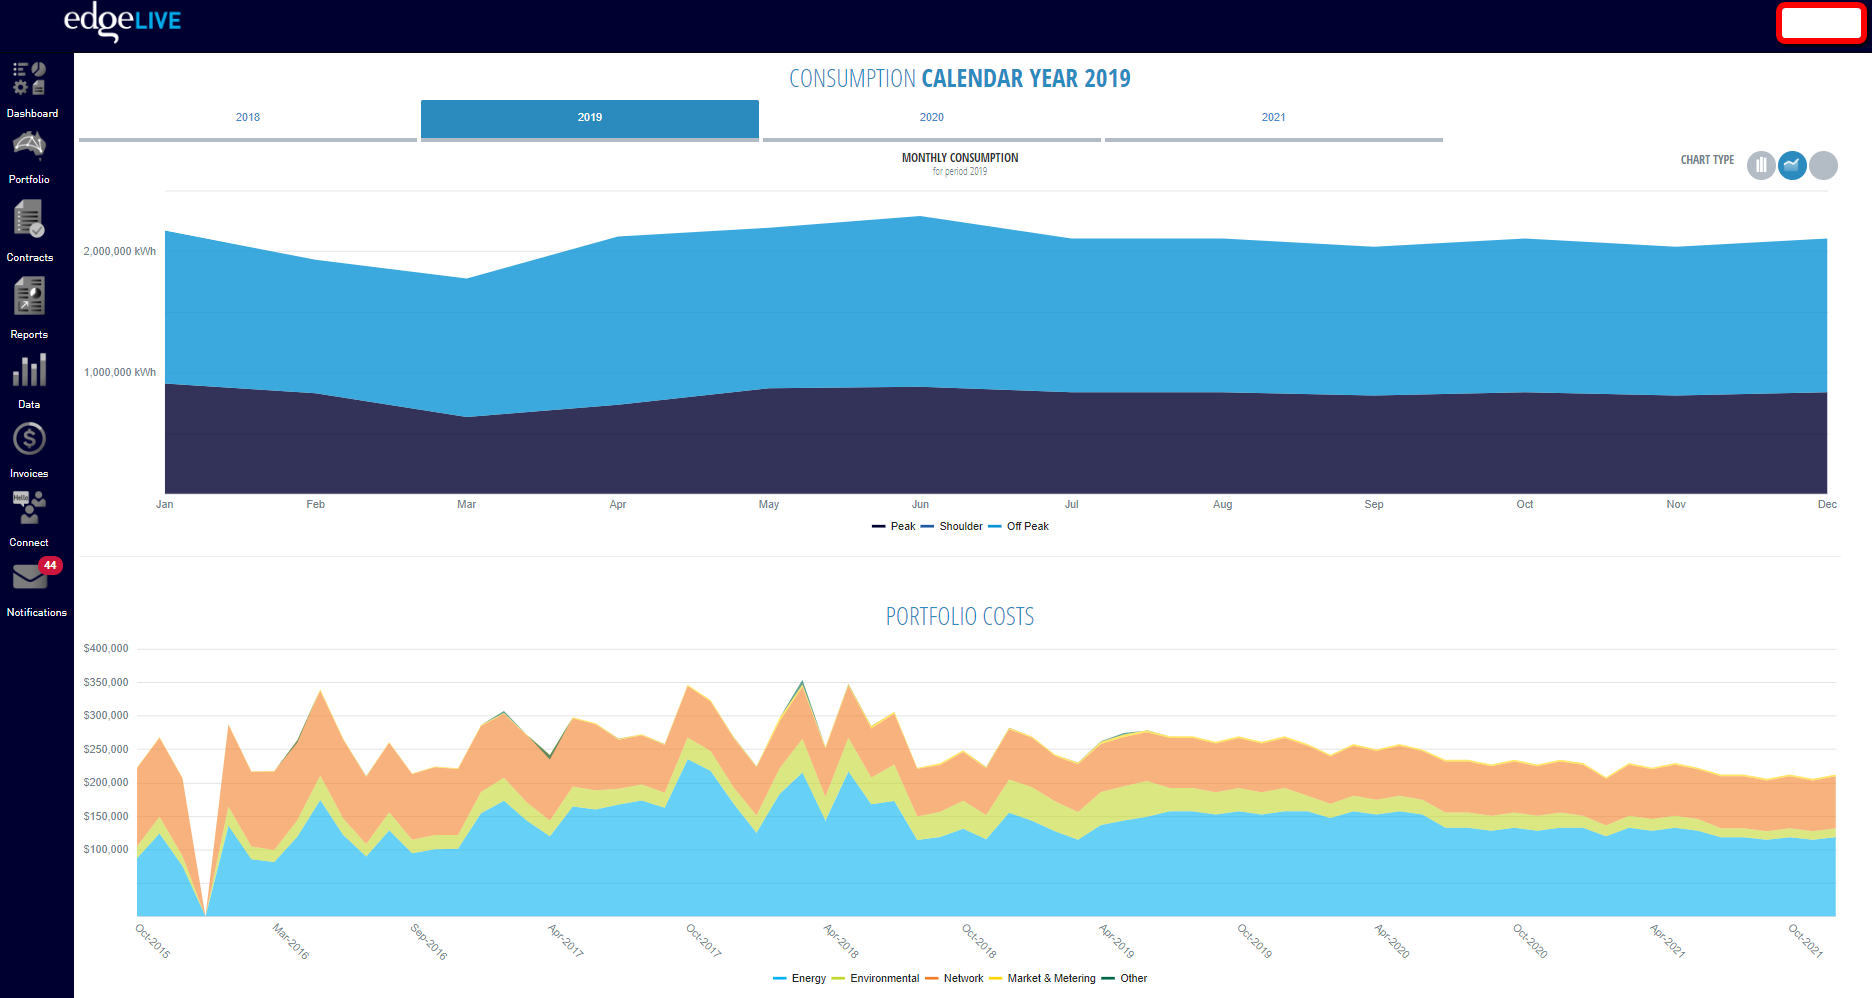
EdgeLIVE also contains a snapshot dashboard to provide a visual representation of both actual and forecast energy costs for our customers’ whole energy portfolio. The snapshot dashboard contains a range of graphics and tables to show trends relating to costs and consumption on a portfolio, asset or NMI level.

Export functionality

In addition to the online dashboards, EdgeLIVE also allows the export of accrual, invoice reconciliation and snapshot data to a ready-designed report format in Excel. As with the dashboards, this report shows actual and forecast costs and consumption on a portfolio or NMI level.

The exported report is delivered directly to your email to save for future reference and is ideal for use in your budget processes or as inserts into any business presentation or documentation.

Upcoming changes

In addition to the above, our technology team continue to work on further developments to be released. Over the coming months we will introduce a finance dashboard which will track spend against retailer purchase orders and display live tracking of savings achieved, such as early payment discounts.

If you would like to discuss our EdgeLIVE platform, please contact Edge on 07 3905 9220.

Supporting Mater Little Miracles

Finding a charity to donate to can be a tough exercise considering the fantastic work that hundreds of charities do on a daily basis. Having worked with many charities in the past as an organisation, Edge’s National Sales Manager, Mike Ricketts, has been donating to Mater Little Miracles for 3 years now.

What do Mater Little Miracles do?

Every baby born at Mater is a Mater little miracle. That’s one in seven Queenslanders and more than 10,000 new babies every year who can proudly say, “I’m a Mater baby.”

But sadly, not all babies are born healthy. Some are born premature, are seriously ill, or are simply too small to go straight home with their parents.

Mater is dedicated to providing the best possible start to life for the seriously ill and premature babies cared for at Mater by raising vital funds through Mater Little Miracles.

More than 2,000 babies each year will have to spend time in our Neonatal Critical Care Unit (NCCU) where specialist staff treat and care for up to 79 seriously ill and premature babies every night.

Some babies are born as young as 24 weeks and weigh as little as 400 grams, some have come from as far as Cairns and Townsville for the specialist neonatal care for which Mater is renowned.

Thanks to donations like Mike’s, the Mater Foundation has provided over $51 million of funding to health, education and research.

If this is your first time, we encourage you to donate and if you are a regular, we thank you. To donate or to learn more about Mater Little Miracles, please follow the link – https://www.materlittlemiracles.org.au/

STAFF PROFILE – Mike Ricketts

What is the best piece of advice you have ever received?

The best piece of advice I’ve ever received would have to be ‘Don’t worry about the things you can’t control but focus on the things you can.’

Name a place you have never been to and would like to visit. Why?

I have always wanted to visit the Amazon Rainforest. The sheer scale of it is mind blowing.

Who or what inspires you?

Individuals that have been classed as ‘disadvantaged’ by society but live a life just as full as any other. Seeing ‘less fortunate’ people enjoy what they have is extremely inspiring.

What is one of the biggest challenges facing energy customers today?

I feel the biggest challenge customers/consumers face today is the everchanging nature of the market and industry. With constant regulation changes, price spikes and conflicting opinions, our role in the industry becomes more and more prominent year on year. It keeps it interesting for people like me, motivating me each day to assist businesses understand and stay ahead.

What does a typical day look like for you at Edge?

A typical day for me is full of energy and fast paced. I am constantly looking for new ways to improve and grow the business whilst learning all I can about this complex industry. There is always something to do.

Enhancements to RERT

The Reliability and Emergency Reserve Trader (RERT) is an existing intervention mechanism that allows the Australian Energy Market Operator (AEMO) to contract for additional reserves such as generation or demand response that is not otherwise available in the market. AEMO uses RERT as a safety net at times when a supply shortfall is forecast or where practicable for power system security.

RERT is classified as an emergency reserve or strategic reserve as it may only be used as a last resort to avoid unnecessary load shedding. This is typically required when the market is under pressure from extreme weather or during unexpected generation failure.

RERT can be additional generation or load curtailment that must be able to respond on request from AEMO. It cannot be available to the market including through any agreement or arrangement including demand side management agreement. The amount procured is to ensure AEMO meets the reliability standard in all regions.

Demand Side Participation or demand side response (DSR) comprises the largest component of RERT. DSR could be when factories or manufacturing processes adjust their production in order to reduce electrical load. Once enabled DSR is relatively simple to manage however the contract negotiations, setup and determination of volume and times are complex. Payments are made up of an availability fee and a dispatch fee which as it is linked to lost production is generally high.

Participants will normally require several hours or days notification and may also have minimum and maximum constraints on volume and time periods.

Enhancements to RERT

The AEMC has released new rules to reinforce the emergency reserve mechanism to protect reliability and encourage the long-term capacity of RERT services at the lowest cost and reduce the occurrences where AEMO is required to use higher cost safety net options.

The market is evolving so the emergency reserve framework needs to evolve to allow AEMO to be more flexible to meet the operational needs of a market with a Large number of smaller generators compared to the current grid made up of a small number of large generators.

New RERT Rules

Improve incentives for customers to reduce demand and minimise the need for emergency reserves

The rule is to incentivise more demand response. Retailers and demand response providers can reduce energy during generally high demand times by incentivising end users to reduce energy when most required.

Increased transparency

There is a recognition of the impact of the RERT on the market and consumers. AEMO will be required to provide regular update on the procurement, usage and cost associated with RERT. AEMO will introduce new reporting requirements to clearly explain the reason for RERT procurement.

Clarify the trigger

If AEMO forecast that there is not enough generation available to supply 99.99% reliability standard the RERT can be triggered. The procurement volume will be the amount AEMO considers is reasonable to fill the gap to meet the reliability standard.

Lead time to buy reserves increased to 12 months

The planned retailer reliability obligation RRO has two triggers. The three-year trigger requires retailers to bring dispatchable firm capacity to market if there is a supply gap three years out. If retailers have not filled the gap 12 months out then AEMO can use the RERT.

Encourage a lower-cost competitive market response

Through the rule changes, AEMO are seeking a lower-cost reliability response from market participants and through current market mechanisms (ie. generator recall) to avoid levers such as load shedding and use of emergency reserves.

Guidance to AEMO on costs

Providing AEMO with guidance as to costs when entering into emergency reserve contracts, along with aligning costs of the emergency reserve contracts with the customers who have caused the requirement for emergency reserve procurement, increasing transparency of costs, and assisting market participants and customers in planning for such costs.

AEMO with flexibility

AEMO has flexibility and discretion as to how the reliability standard is incorporated in its day-to-day operations, particularly through its modelling and forecasting of power system risks.

Benefits

As RERT procurement will be linked to the reliability standard there will be greater transparency as to when and how reserves will be used, this will assist in the planning for RERT costs by market participants and consumers.

Allowing AEMO more flexibility in the range of services it can procure, allows it to better incorporate these services into the day to day operation of the NEM.

Increasing the lead time for procurement of RERT from 9 months to 12 months will allow more RERT providers to participant and likely will result in lower costs to end users.

Changes also allow the cost associated with RERT to be aligned with customers who caused the need for RERT.

Implementation

The enhancements to RERT will be implemented over two stages, reporting commencing 31 October 2019 and the remaining components commencing 26 March 2020.

The timeframe is to allow AEMO to finalise internal processes and the RERT guidelines to be updated.

If you would like to know more about the enhancements to RERT and how your business may be affected, please call Edge on 07 3905 9220.

Gas Market Update

Nick Clark, Edge Energy Analyst

The Queensland State Government increased the petroleum royalty rate by 2.5% to 12.5% in the 2019/2020 budget, claiming that it will increase revenue by $467 million over the four years ending 2022/2023. The increase received condemnation from LNG producers and their investors. In the announcement, Queensland Treasury drew comparison to royalties in the USA and Canada. The resources sector at large has claimed that the higher tariffs put future investment and jobs at risk.

AGL announced during the week that it anticipates first gas to be delivered from its proposed LNG import terminal in the second half of FY22. Originally, AGL indicated that gas would be delivered during FY21, however it is understood that environmental requirements as set by the Victorian Government have caused delays. AGL announced that the floating storage vessel, Hoegh Esperanza would be utilised for the job. It is estimated that the LNG import terminal will be able to send between 80-100TJ/gas per day.

Hydrogen

The COAG Energy Council Hydrogen Working Group has released 9 issues papers which are to help develop the National Hydrogen Strategy. The nine papers released are:

  1. Hydrogen at scale
  2. Attracting hydrogen investment
  3. Developing a hydrogen export industry
  4. Guarantees of origin
  5. Understanding community concerns for safety and the environment
  6. Hydrogen in the gas network
  7. Hydrogen to support the electricity systems
  8. Hydrogen for transport
  9. Hydrogen for industrial users

The hydrogen strategy revolves around producing hydrogen from renewable energy sources to create “clean” hydrogen. Australia has recognised its competitive advantage in producing clean hydrogen due to the solar and wind (renewable electricity required in production of clean hydrogen) resources. The market for hydrogen is currently small relative to other energy sources such as gas and coal however with increasing appetite for low emissions fuel it is anticipated that this will grow. The potential size of the market is unknown. Unsurprisingly parties that stand to benefit from hydrogen becoming a more widely used fuel source anticipate huge growth whereas the more moderate are generally in a wait and see phase.

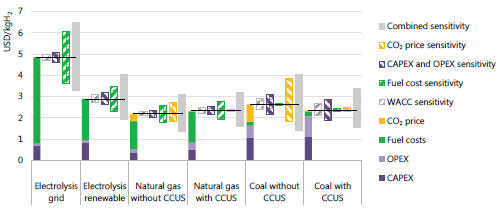
Currently cost of producing hydrogen remains high and makes the fuel uncompetitive as well as having no commercial scale shipping capacity. Hydrogen production costs for different technology options according to the International Energy Agency are summarised below:

Source: International Energy Agency. “The Future of Hydrogen, seizing today’s opportunities” June 2019 p.g. 52

It cannot be understated how substantial the task is to deliver on the COAG Energy Councils vision of Australia becoming a major clean hydrogen player. The table below provides a high-level timetable for actions to 2030 as prescribed by the COAG Energy Council.

Gas Powered Generation

Gas powered electricity generation has been, is, and will continue to be critical to ensuring reliable electricity supply in the NEM. Recently, gas has started to become displaced by new renewable generation in the NEM. Gas however remains critical at times of tight supply and demand balance. The graph below summarises the daily gas used for gas powered generation (Source Australian Energy Regulator) dating back to Q308.

Source: AER

On aggregate we can see that gas generation reached its minimum level since Q308 in Q418. This is primarily driven by new renewable generation in the form of wind and solar. Queensland gas demand has declined after Q414 on the back of Swanbank E mothballing. We also note the rise in SA which corresponds with the closure of Northern coal power station in SA. As the energy market continues to transition to intermittent renewable fuel sources and a 5-minute market, there is interest in adapting existing gas power stations to be able to respond more quickly.

Regional analysis

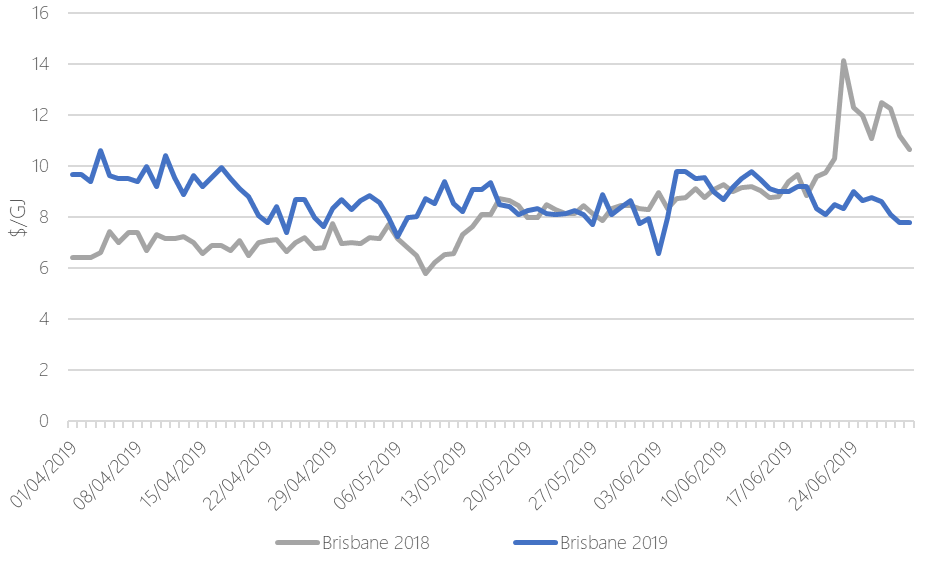
Brisbane

Gas prices in the Brisbane STTM were marginally higher in Q219 relative to Q218, averaging $8.72/GJ. There was no material change in volumes traded through the STTM.


(Source: AEMO)

Sydney

Sydney Q219 average STTM price was $9.79/GJ, which was $1.26/GJ higher than the Q218 average price. Prices during Q219 were highest at the beginning of the month.


(Source: AEMO)

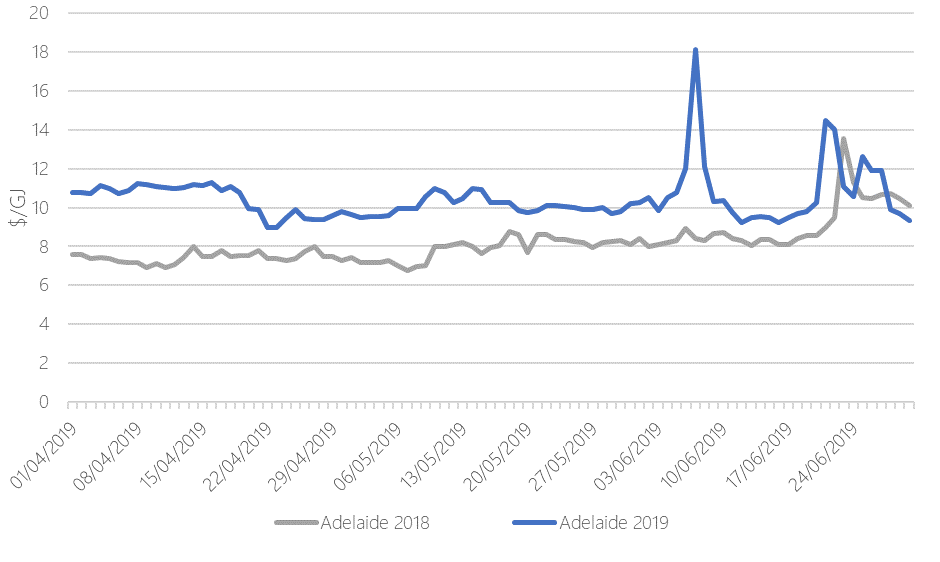
Adelaide

Adelaide Q219 average STTM price was $10.45/GJ which was $2.29/GJ higher than the Q218 average price. Sustained higher prices as well as a spike during June contributed to the higher average price.

(Source: AEMO)

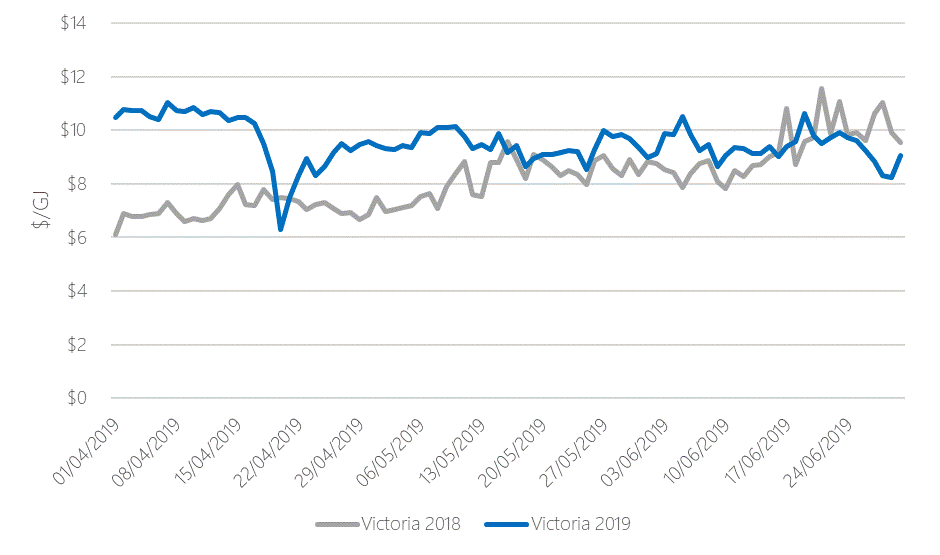
Victoria

Victoria Q219 average gas price was $9.54/GJ which was $1.36/GJ higher than the Q218 average price. Prices were higher earlier in the quarter then converged in May. In late June gas prices softened, potentially on the back of less demand from electricity generators due to high wind.

(Source: AEMO)

If you would like to know more about what is happening in the gas market and how your business may be affected, please call Edge on 07 3905 9220.
STATE OF THE ELECTRICITY MARKET – AUTUMN MARKET OVERVIEW

Alex Driscoll, Manager Wholesale Clients and Markets

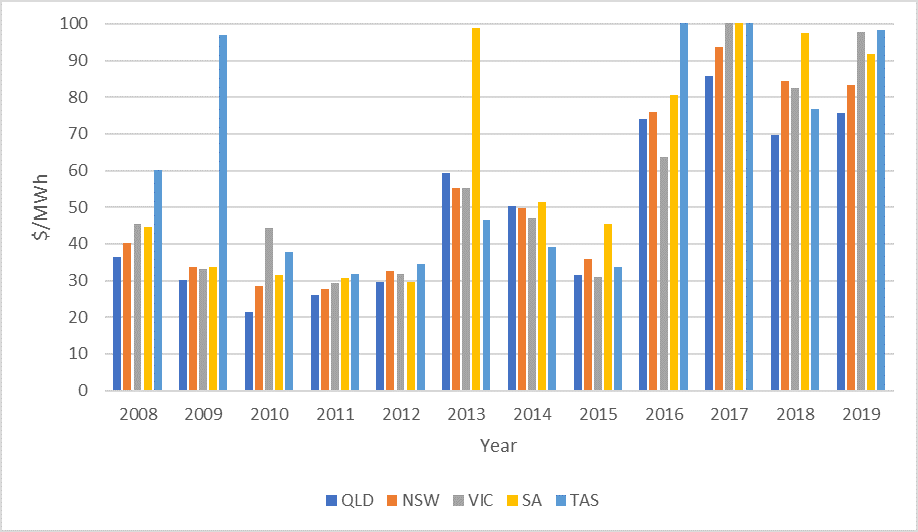
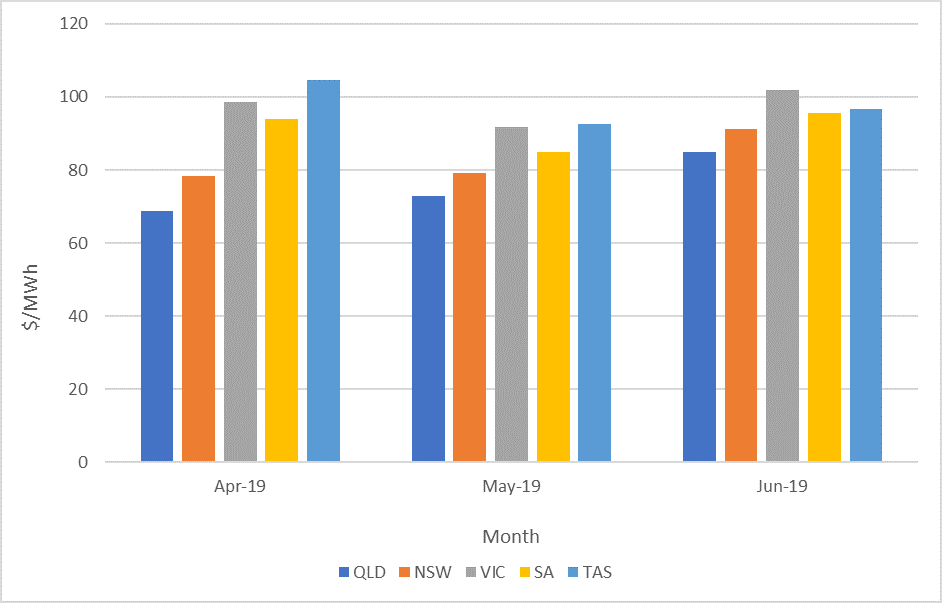
The electricity spot prices in Q219 (April to June) were unsurprisingly lower than the preceding 3 months of Q119 (January to March). Although Q219 experienced some volatility, this was far from the extremes we saw in Q119 with VIC and SA hitting the market price cap in February.

Prices during Q219 were higher than Q218 in QLD, VIC and TAS, however lower in NSW and SA. Looking back across the last 10 years, prices have been higher for all regions.


Figure 1: Historical prices for autumn

(Source: AEMO)

It should be noted that prices in both 2012 and 2013 were affected by a carbon tax, which was subsequently repealed in 2014. Since 2015 there has been a steady price increase in all mainland NEM regions. In Queensland, the Government provided a direction to Stanwell Corporation and CS Energy to adopt strategies to reduce wholesale prices. Since the direction, there have been fewer price spikes (prices above $300/MWh), although average prices have continued to increase.

Spot prices and volatility were low during the first part of Q219 as a result of high availability, low demand and generators bidding volume in low price bands.  By the end of May, peak daily price increased as a result of operational demand increasing. This stems from rooftop PV rolling off and increased use of household appliances. Spot prices continued to increase through June as both rooftop PV and commercial solar were impacted by shorter daylight hours and intra-regional constraints. NSW price increases were primarily driven by demand increases attributed to colder temperatures.

Snowy Hydro continues to draw down its dam levels to cover cap contracts and supress prices below $300/MWh.

Q219 saw an increased level of generation from gas powered generators. Renewable generation increased by 66% to over 3GW from the start of the year. Operational demand continues to drop as a result of a reduction in energy intensive industries, energy efficiency and the increased uptake in rooftop PV.

Figure 2: Average monthly spot prices in the NEM

(Source: AEMO)

The Market Operator issued various directions to participants in SA during Q219 to maintain the power system in a secure operating state. Synchronous generating units were directed to operate or remain synchronised to maintain power system security.

Coal fired generation continued to reduce, with the lower level of generation driven by unit outages and the increase in market share from renewables. Hydro generation consistently increased over Q219 despite low dam levels in NSW, VIC and TAS. Increased generation from wind also continued over the quarter.

Higher spot prices and concerns over the stability of the grid have caused the forward curve to increase. Snowy Hydro continued to draw down on its dam reserves and with a dry outlook, the inflows could be lower than previous years

Looking forward

Figure 3: Calendar year 2020 forward contracts 

$/MWh NSW QLD SA VIC
04-July-19 83.72 73.00 97.00 101.00

(Source: ASX)

There is currently a large pipeline of committed projects waiting to enter the market. These projects are mainly renewable energy, diesel and batteries. Recent updates to the MLFs may reduce this pipeline. The integration of renewable energy generation into the market and the strategies of price setting coal and gas generation will determine if prices will reduce or if a more volatile market will be created. It is unlikely in the near term that spot prices will return to historical levels as renewable generation has not reached a level to consistently set prices at lower levels.

If you would like to discuss the electricity market outlook and potential impact to your electricity portfolio, please contact our Manager Wholesale Clients and Markets, Alex Driscoll on 07 3905 9220.
High solar generation vs spot prices in Queensland

Alex Driscoll, Manager Wholesale Clients and Markets

Solar generation and its impact on spot price is a topic of major discussion, particularly in the ‘Sunshine State’ of Queensland where there is a continuous pipeline of solar generation development. This raises the question: is strong solar generation having an impact on spot prices, and if so, is it lowering or increasing prices?

Increasing Large-scale Solar Penetration in the NEM

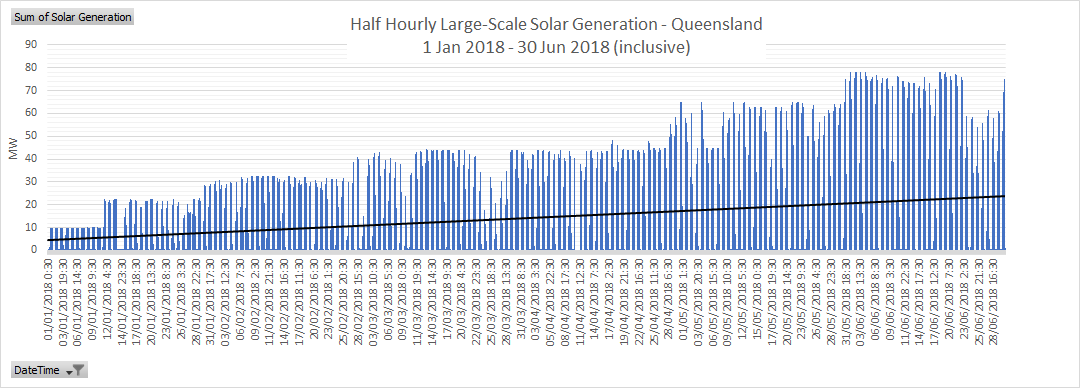
It is no secret that solar generation has increased dramatically over the last 12-18 months. From 1 January 2018 to 30 June 2018 (inclusive) the average daily production of large-scale solar generation in Queensland was only approximately 14.2 MW, only accounting for 0.085% of total Queensland generation.

(Source: AEMO)

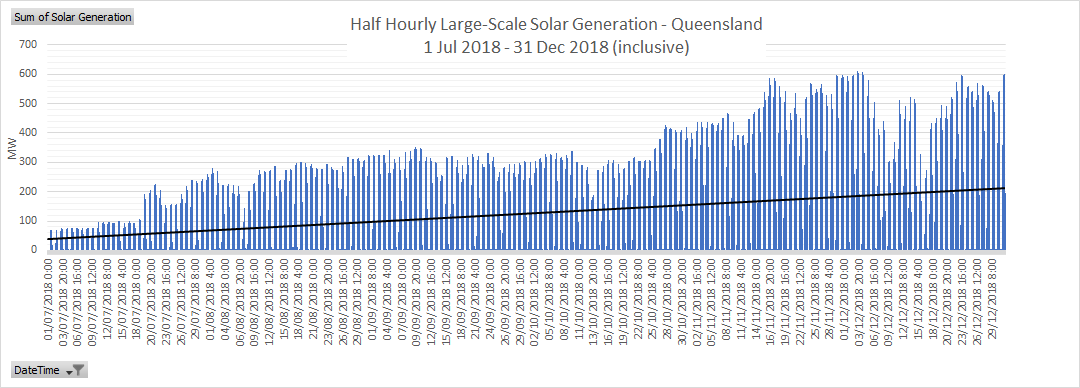
For the six months between 1 July 2018 to 31 December 2018 (inclusive), the average daily production of large-scale solar generation in Queensland increased to 125.3 MW and accounted for 1.9% (an increase of > 1% on the previous 6 months) of total Queensland generation during that period.

(Source: AEMO)

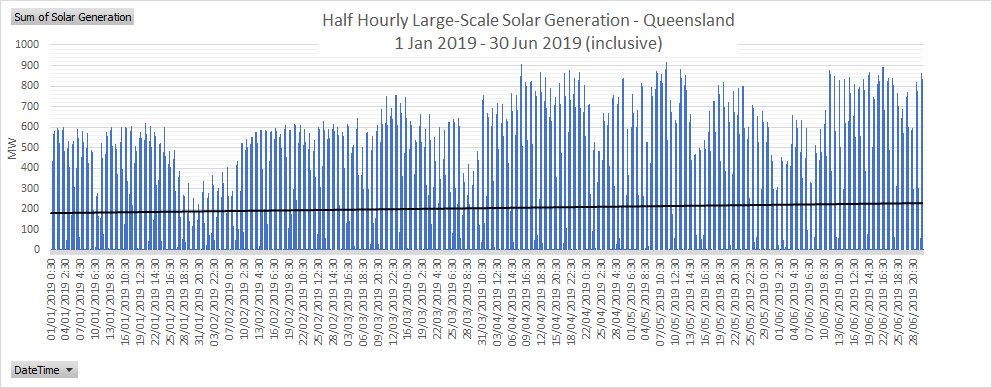
Fast forward to 2019, and generation volumes from large-scale solar generators has continued to increase, reaching a maximum of 917 MW on 08/05/2019 at 11:30. From 1 January 2019 to 30 June 2019 (inclusive) the average daily production of large-scale solar generation in Queensland increased to 205.6 MW and accounted for 3% (an increase of an additional 1% on the previous 6 months) of total Queensland generation.

(Source: AEMO)

The Rooftop (Photovoltaic) Reckoning

So far, we have only evaluated large-scale generation and its penetration in Queensland, however there is another solar photovoltaic beast infiltrating the NEM, namely Rooftop PV (small-scale home and business installations). If we look at similar timelines, home and business owners are deciding to take more control of where their energy comes from, with multiple household and business rooftops opting to install solar panels on what would be wasted space (and opportunity). It is important to understand, rooftop PV falls within AEMO’s (Australian Energy Market Operator) category of distributed energy resources which is subtracted from native demand to determine operational demand.

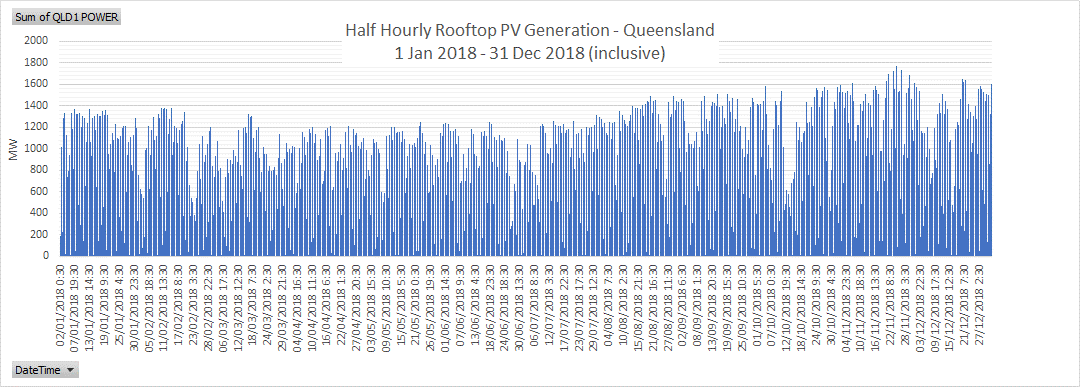
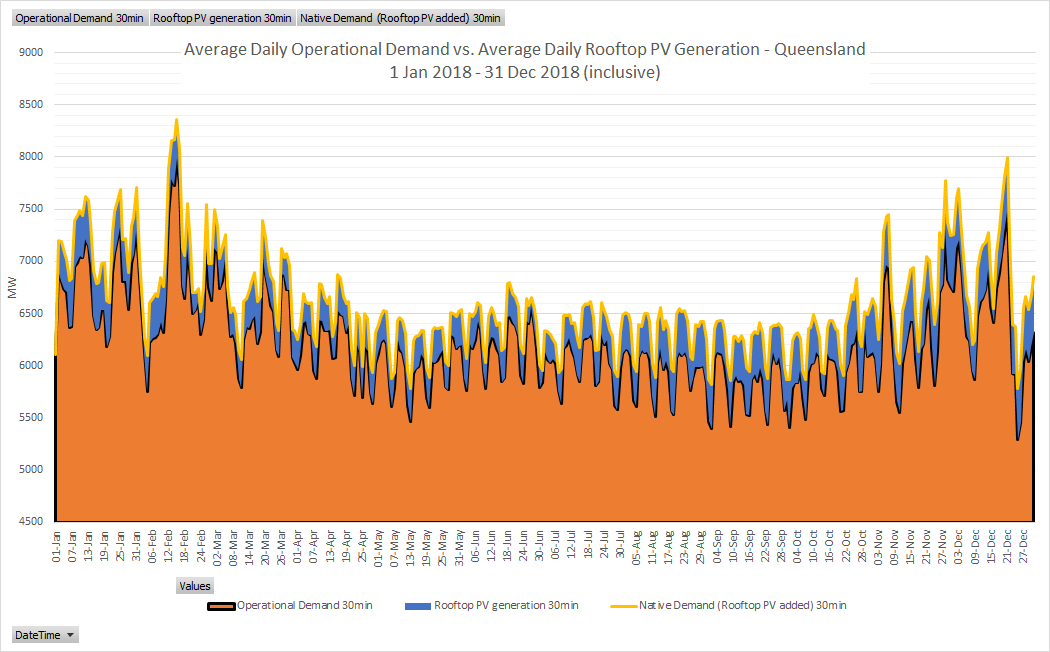
The general trend for rooftop PV is that its contribution to the energy mix is growing constantly. The maximum volume between 1 January 2018 to 30 June 2018 (inclusive) reached 1.4 GW, with the period 1 July 2018 to 31 December 2018 (inclusive) recording a maximum of 1.78 GW. That is an increase of almost 400 MW in six months. On average, rooftop PV reduced native Queensland demand by 345 MW each day on 30-minute demand figures across the entire 2018 Calendar Year.

(Source: AEMO)

(Source: AEMO)

Roughly year-to-date, we have not seen the same strong performance from rooftop PV. However, summer 2020 could provide a new rooftop PV maximum for Queensland and NEM wide with the Australian Photovoltaic Institute recording on average for the period of 1 January 2019 to 31 March 2019 (inclusive), an additional 16,200 reported installations.

(Australian PV Institute Solar Map, funded by the Australian Renewable Energy Agency, accessed from pv-map.apvi.org.au on 4 July 2019)

Impact to Spot Price

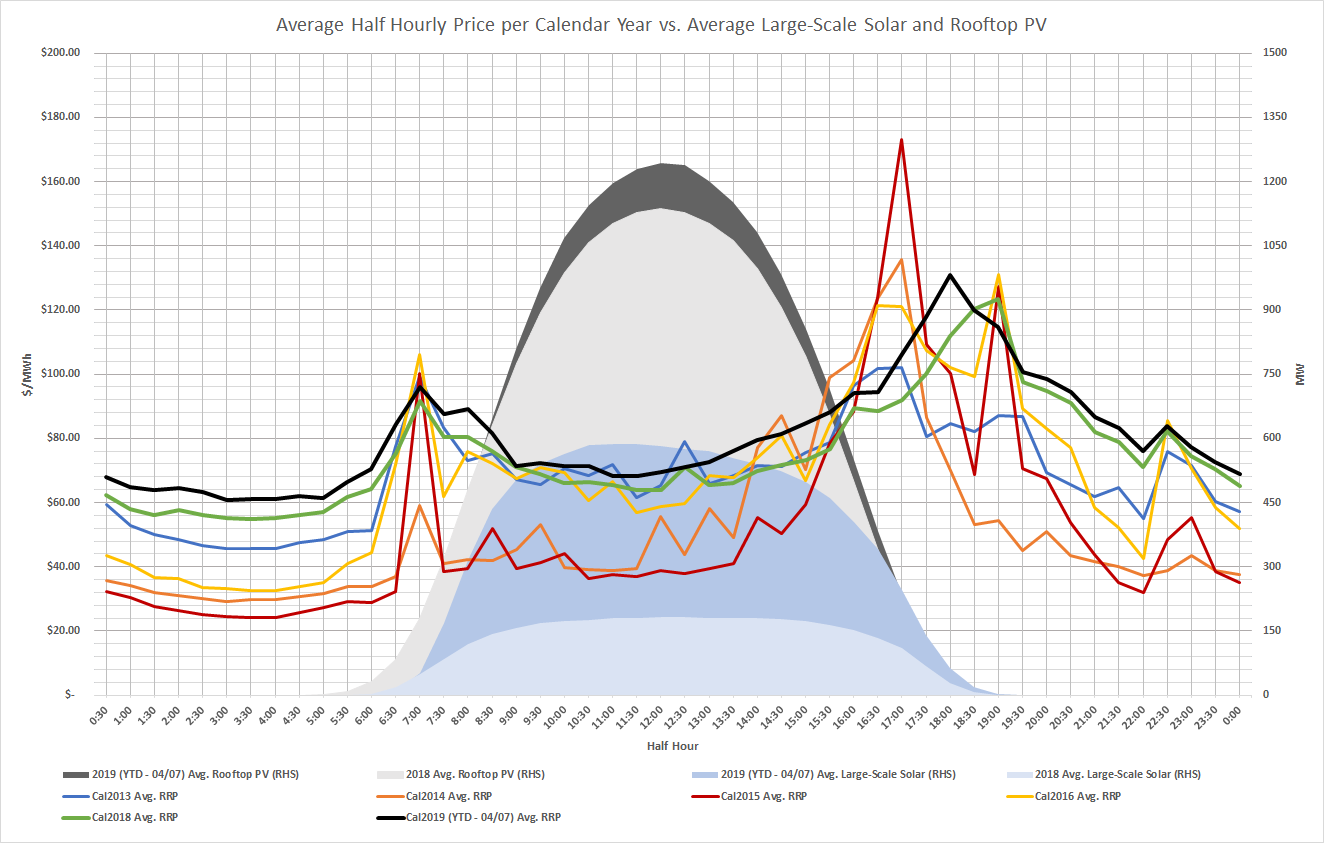
As the graph below depicts the calendar year, daily average half hourly pricing from 2013 to YTD 2019 (excluding 2017 as an outlier with bidding direction from Queensland government to GOCs). Despite the growth and increase in both average (half-hourly) rooftop PV and large-scale solar generation, spot prices have also increased. This is not to say that solar is to blame for the increase in prices, as price has not increased in all hours of the day.

To summarise the changes:

  • The morning peak has remained roughly the same across the years with a sharper ramp-up depicted in earlier years.
  • Evening peak has shifted further into the evening than earlier years depicted and is not as strong.
  • The off-peak hours have become increasingly more valuable in comparison to earlier years.
  • However, the biggest and possibly strangest movement is the daylight hour prices, or solar hours have roughly remained the same (apart from 2014/15).

(Source: AEMO)

We cannot conclusively say that the increase in solar generation is the sole reason for prices heading on an upward trajectory since 2014 (as the table below depicts), however it would be fair to say the increase in solar has played a part in it. The addition of the strong solar penetration has changed the dynamic of the market, causing thermal generators and other fuel types to re-think how they will recover the costs of their 15, 20, 30-year investments. Thermal generators will likely start by displacing the price curve and increasing bids in the off-peak periods. The evidence is clear in that the off-peak periods are now increasingly more valuable than they were 3-6 years ago.

On top of this, a large portion of solar generation is being built north of the Calvale and Wurdong substations in Queensland and is having little effect (unless new infrastructure is built) on middle of the day spot prices. This is due to contingent and operational constraints placed on the power lines by AEMO so as to not overload the lines, forcing generation north of this constraint (solar inclusive) to constrain off. Nonetheless, there are a multitude of factors impacting the price in Queensland and solar generation’s impact on prices should not be overlooked. However, one thing is for certain, spot prices have been increasing since 2014 (see below table) and in the near term show little sign of slowing.

Calendar Year ($/MWh)
QLD 2013 2014 2015 2016 2018 2019 YTD
Avg Spot Price  $    68.41  $    50.91  $    51.96  $    67.32  $    74.82  $    80.64

(Source: AEMO)

If you would like further information on the impact of solar generation, please contact your Manager Wholesale Clients or Edge on (07) 3905 9220.